Market Snapshot
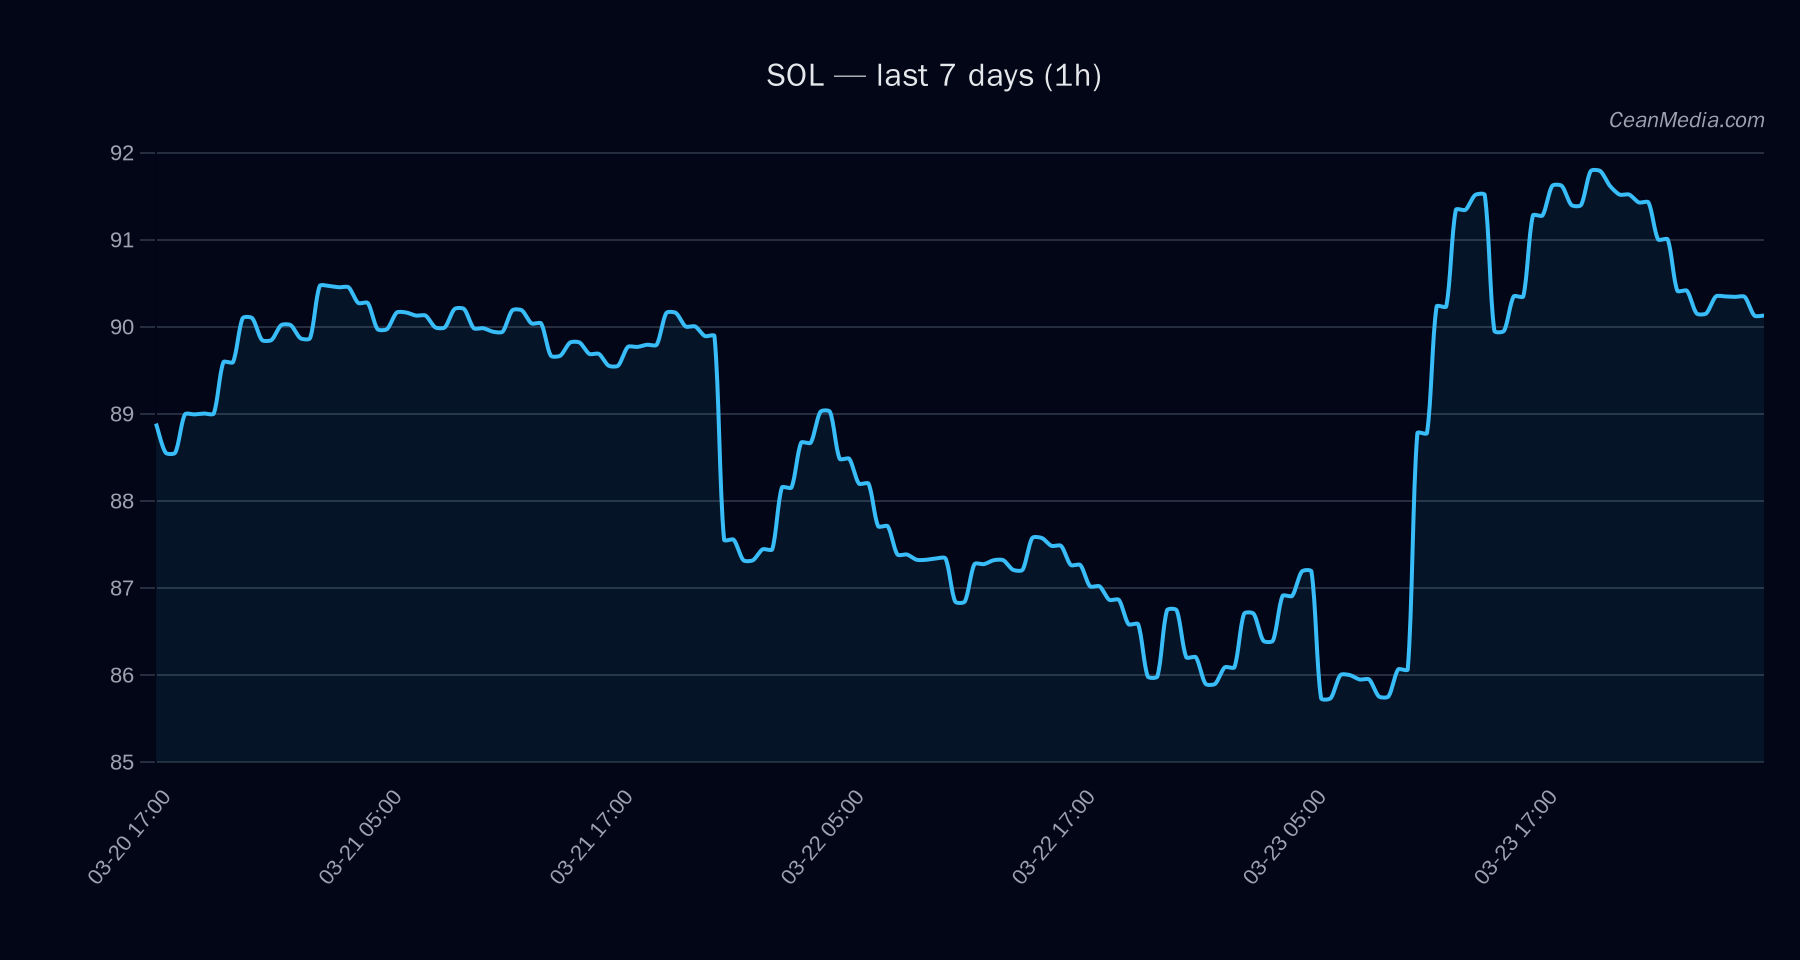
Solana (SOL) trades near key support and resistance boundaries as of 2026-03-24. The price sits around 90.3 with a near-term bias described as up by the model, albeit with a sideways technical backdrop given EMA and SMA relationships and a neutral RSI. Market breadth remains favorable in broader indicators, while volatility is described as very low.
Technical Analysis: SOL
- Current level: 90.3
- Band and range: P20–P80: 84.40–92.41; P50 (center): 88.08
- Support / Resistance: Major Support 85.8 | Near 88.5; Major Resistance 93.8 | Near 92.1
- Bias: Forecast: Up (approx. 49% probability), with a sideways-tone TA
- Key technical signals: EMA12 > EMA26, SMA50 < SMA200, RSI 55; Volatility: σ24h ≈ 0.96%; Volume regime: Very low
- Price targets on breakouts: Break above 92.1 → potential 93.95–95.79; Break below 88.5 → potential 86.72–84.95
- Invalidation/relative triggers: A move back below 88.5 would weaken the near-term up scenario; a sustained move above 92.1 reinforces the bullish trajectory.
Drivers
- Return over the last 24 hours: +0.03
- EMA slope: -0.0007 (minor negative slope, implying a flat to slightly bearish intermediate trend)
- Order-book imbalance (EMA5): 0.04
- BTC 24h return: +0.02
- BTC volatility regime: 1 (low to moderate volatility context)
- BTC trend strength: 0.51 (modest correlation with BTC)
- Overall volatility regime: Very low
- Distance from MA (momentum proxy): +0.99% (slightly extended above moving average)
- Other stress/flow metrics: mixed signals, with breadth in broader market favorable (Breadth > 50h: 83%)
ETF Flows (BTC/ETH)
Contextual note: ETF data presented here pertains only to BTC and ETH and is not a primary signal for SOL. It provides backdrop on risk sentiment and market participation. BTC ETFs show mixed signals over 1D, 5D, and 10D horizons, suggesting cautious risk-on/off dynamics rather than a decisive directional bet. ETH ETF data is negative on the 1D view, though longer horizons show some net positive movement.
- BTC ETF: 1D +$6.4M | 5D -$61.6M | 10D +$630.6M
- ETH ETF: 1D -$1.6M | 5D +$24.2M | 10D +$167.0M
What to Watch Next
- Monitor close above 92.1 to validate upside continuation toward 93.95–95.79.
- Watch for a sustained move below 88.5, which would open risk to 86.72–84.95.
- Keep an eye on BTC ETF signals for broader market risk sentiment, acknowledging they are contextual rather than SOL-specific signals.
- Observe volatility regime; a shift from very low could precede sharper moves and alter risk management levels.
Hashtags: #Solana #SOL #CryptoAnalysis #MarketSnapshot #TechnicalAnalysis #ETFFlows #BTC #ETH #RiskOn #RiskOff #CryptoMarkets