Market Snapshot
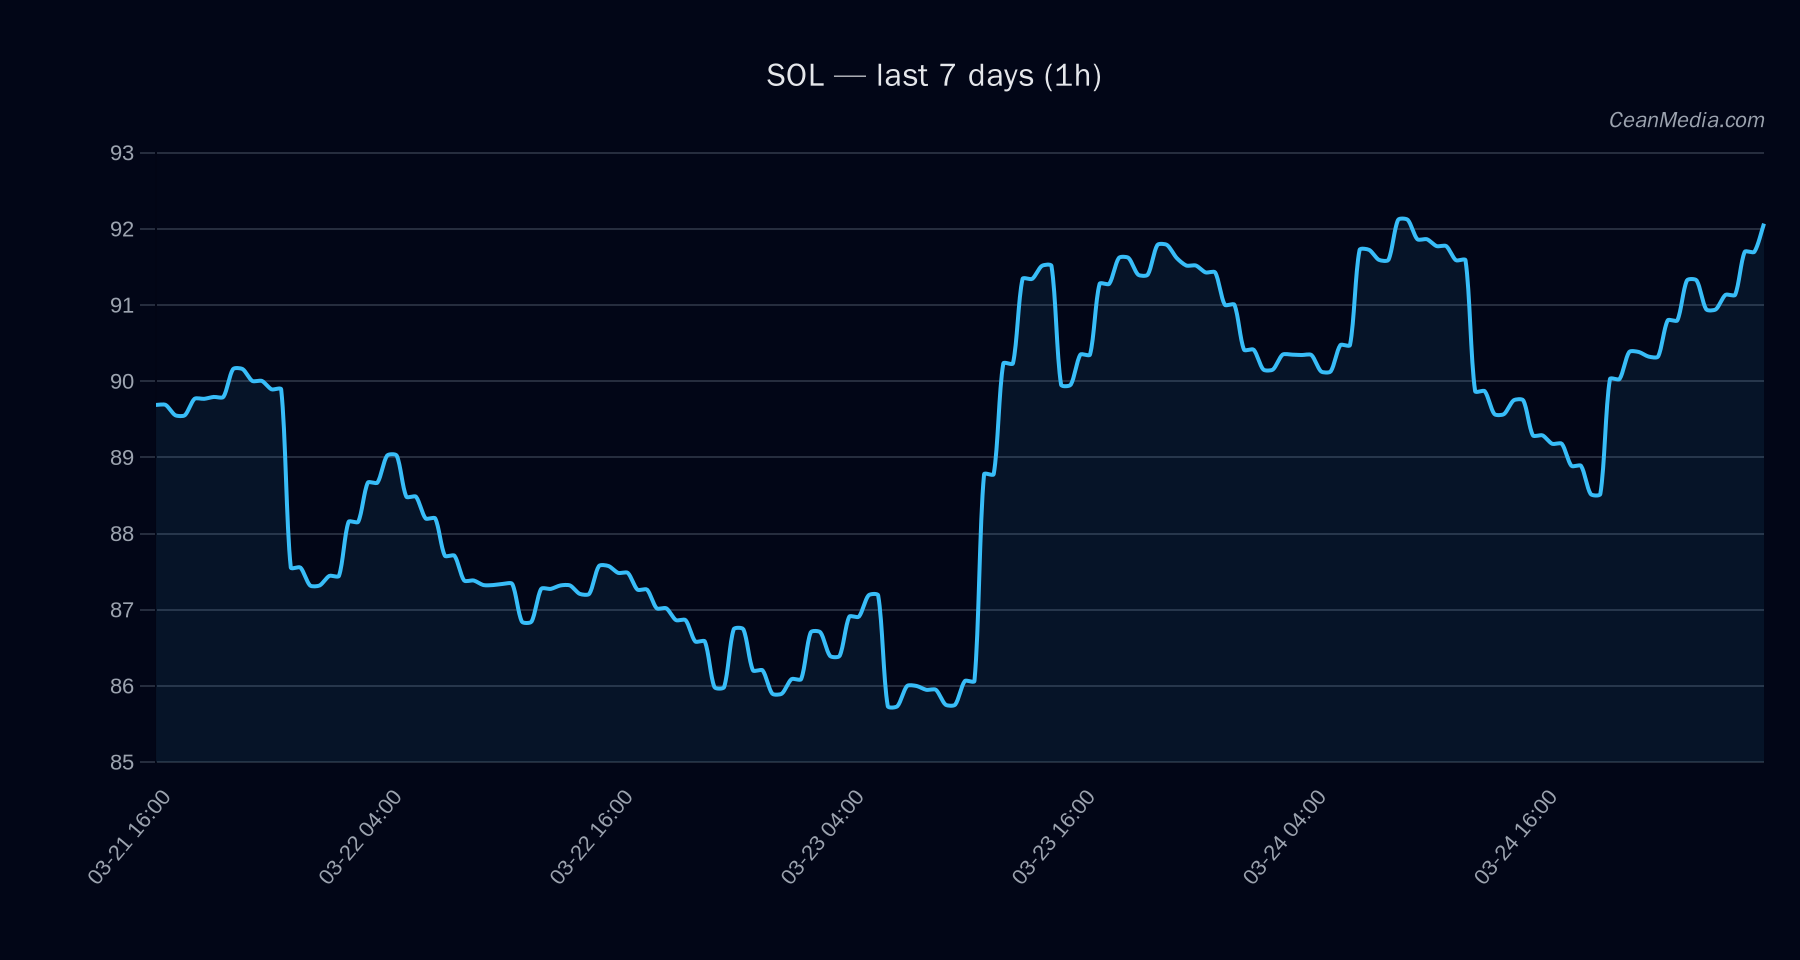
On 2026-03-25, SOL is trading around the mid-90s with a defined range between 85.8 (support) and 93.8 (resistance). The near-term bias leans modestly upward according to the provided forecast, with a 49% probability of an upside move in the next session. Market context includes very low volatility bandwidth and a positive but measured trajectory, with notable BTC-linked breadth and mixed sentiment indicators.
Technical Analysis: SOL
- Current price: 92.8
- Bias: Up (49% probability) with sideways-leaning technical backdrop (EMA12>EMA26, SMA50
- Key levels:
- Support — Major: 85.8
- Support — Near: 90.9
- Resistance — Major: 93.8
- Resistance — Near: 94.7
- Forecast trigger ranges:
- Upside: 1h close > 94.7 → 96.55 – 98.44
- Downside: 1h close < 90.9 → 89.13 – 87.31
- Momentum indicators: RSI 67 (neutral to slightly elevated), vol regime: very low, σ24h: 0.71%
- Trend alignment: EMA12 above EMA26 is a bullish slope alongside SMA50 below SMA200, indicating mixed long-term alignment with a near-term bullish tilt.
- Key levels:
Drivers
- Top drivers include Return 24H (0.02), EMA slope (0.0023), and Basis Z-Score (2.15).
- Funding Z-Score is modest at 0.28, indicating light funding pressure.
- Order-book imbalance (EMA5) at 0.07 suggests constructive but cautious order flow.
- BTC-related metrics: BTC Return 24H (0.0085) and BTC Trend Strength (0.35) show a positive but modest correlation in the last 24 hours.
- Volatility regime: very low; breadth signals (Breadth > 50h: 100%) reflect broad participation but low volatility context.
ETF Flows (BTC/ETH)
The ETF flow data provided is limited to BTC and ETH instruments and is context rather than a primary signal for SOL. The data indicates net outflows for BTC ETFs of -$61.9M in 1D, -$322.9M in 5D, and +$510.9M in 10D, while ETH ETFs show -$1.9M (1D), -$118.3M (5D), and +$164.8M (10D). These flows suggest ongoing mixed risk-on/off dynamics in BTC/ETH exposure, which can influence broader market sentiment, but should not be treated as a direct predictor for SOL moves.
What to Watch Next
- Monitor 1h close relative to 90.9 (near-term support) and 94.7 (near-term resistance) for potential breakout or breakdown triggers.
- Observe RSI behavior near 67–70 to assess momentum divergence or continuation.
- Track BTC price action and BTC Trend Strength as a contextual backdrop for SOL, given cross-asset sensitivity.
- Watch for changes in volatility regime; a shift from ‘Very low’ to higher volatility could alter the current risk profile.
Hashtags: #SOL #Solana #CryptoAnalysis #TechnicalAnalysis #ETFFlows #BTC #ETH #MarketOutlook #CryptoMarkets #PriceAction #Momentum #RiskManagement