Market Snapshot
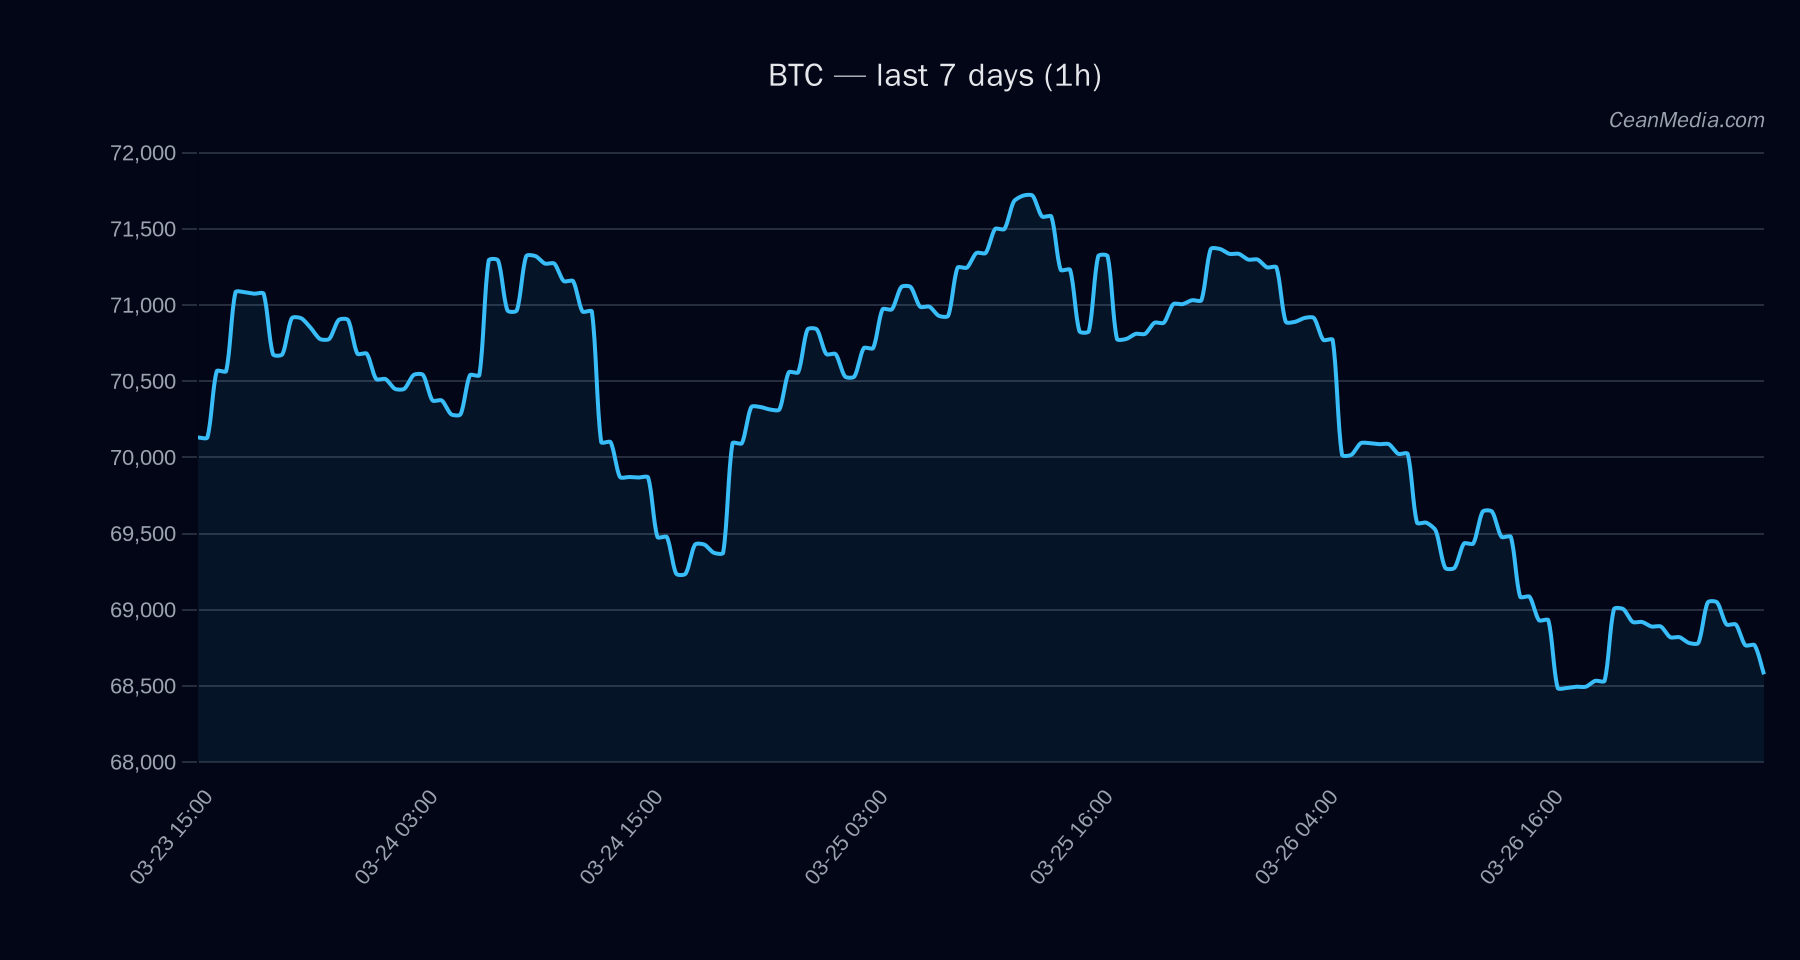
BTC continues to trade within a defined range near the 68,850 support and 69,975 resistance, with a near-term upside bias observed in the current forecast. The intra-day price is around 68,600, and market breadth remains subdued with very low volatility regime.
Technical Analysis: BTC
68,600.06 Up (42% probability of a close above the near-term resistance) - Support (Major): 68,850
- Support (Near): 67,225
- Resistance (Major): 71,900
- Resistance (Near): 69,975
1h close > 69,975 → targeted 71,371.50 – 72,770.94 1h close < 67,225 → targeted 65,883.50 – 64,538.94 EMA12 Trend strength ~1.73; ETF-like flow signals unchanged in the 24h window; breadth readings are subdued (Breadth>50h: 0%) Break above 71,900 would reframe the bullish case with potential upside into 72k+; a break below 67,225 would accelerate a move toward the 64k–65k region.
Drivers
- Return over 24h: -0.03%
- EMA slope: -0.0009
- Funding z-score: 0.75
- Basis z-score: -0.83
- Order-book imbalance (EMA5): 0.19
- BTC 24h return: -0.03%
- BTC volatility regime: very low
- BTC trend strength: 1.73
ETF Flows (BTC/ETH)
Context: The ETF flow figures provided relate to BTC and ETH ETFs. This data should be viewed as contextual rather than a primary signal for BTC price action. The latest figures show net outflows in BTC ETFs over 1D and 5D horizons, with a 10D period showing a net influx, while ETH ETFs exhibit similar directional tendencies in recent frames. This information should be used to gauge broader market sentiment and potential risk-on/risk-off shifts rather than as a standalone BTC trading signal.
- BTC ETF: 1D -$129.4M | 5D -$158.4M | 10D +$205.4M
- ETH ETF: 1D -$38.9M | 5D -$60.6M | 10D +$79.5M
What to Watch Next
- Monitor a close above 69,975 to confirm upside continuation toward 71,900–72,770 range
- Watch for a break below 68,850 to assess slope toward 67,225 and potential downside risk
- Keep an eye on ETF flow context as a supplementary gauge of risk appetite, noting BTC/ETH ETF directional tendencies
- Observe changes in volatility regime and breadth signals for signs of regime shift
Hashtags: #BTC #Bitcoin #MarketAnalysis #TechnicalAnalysis #ETFFlows #CryptoMarkets #CryptoTrading #RiskOnRiskOff #Volatility #Momentum #OnChain #MacroCrypto