Market Snapshot
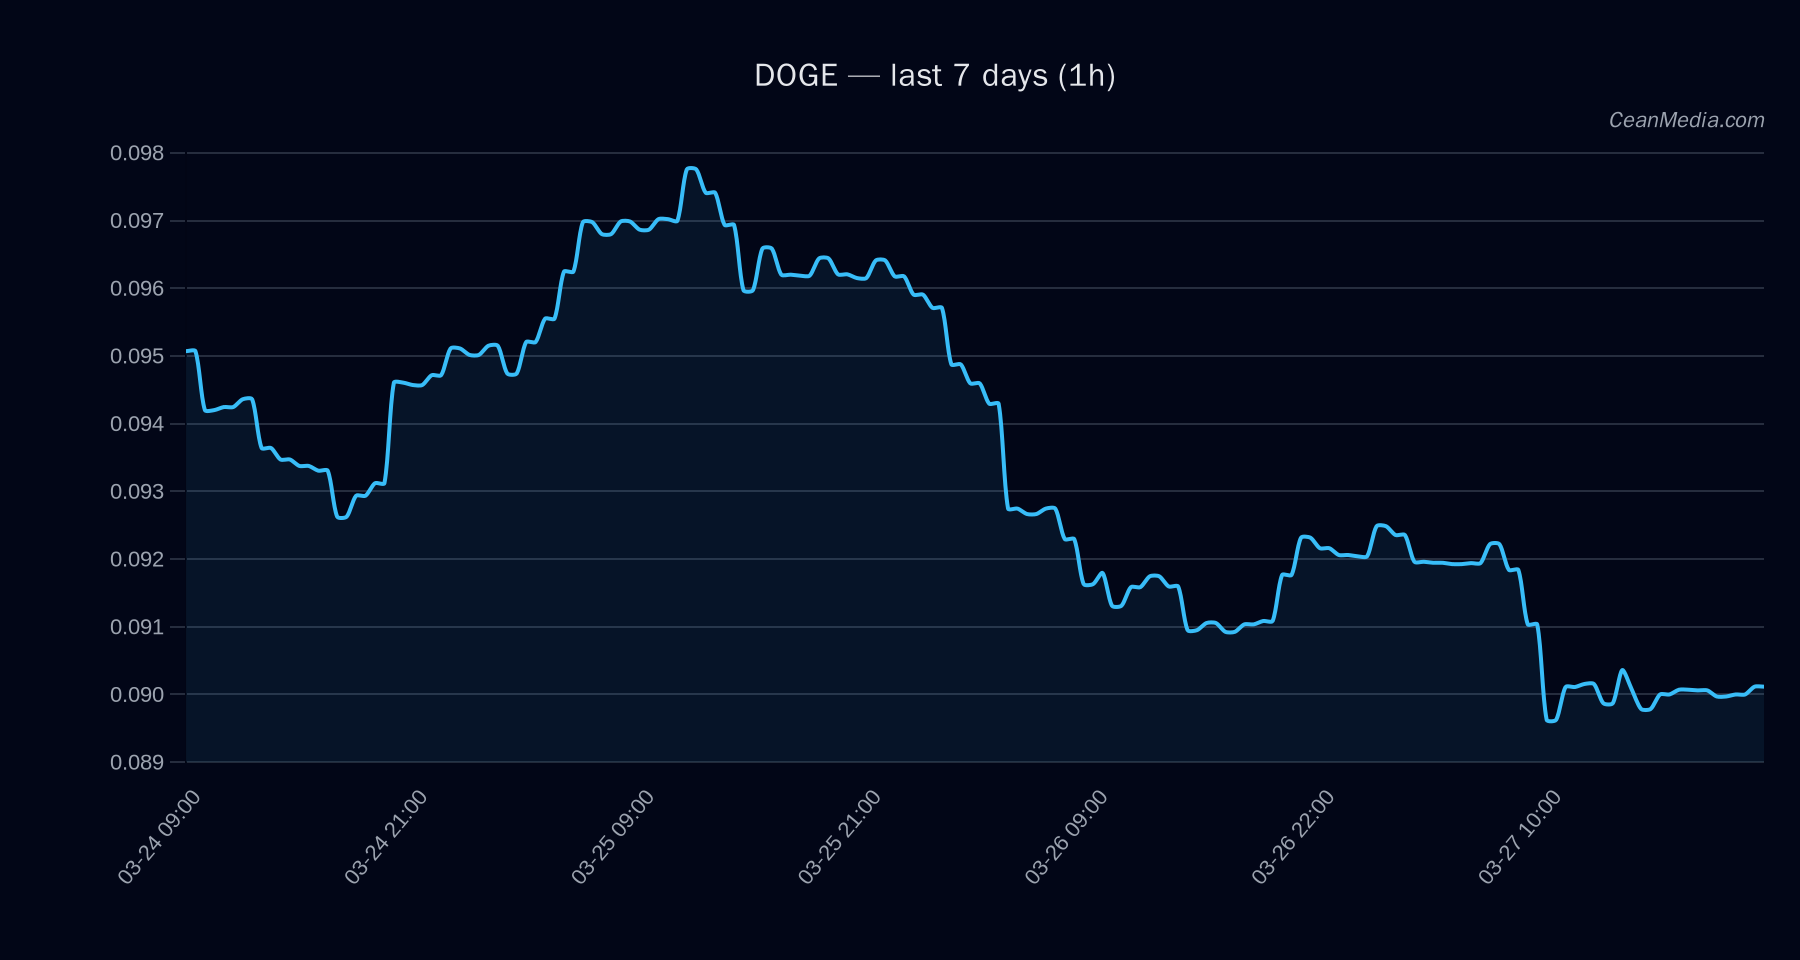
DOGE trades around the 0.0900 region with a short-term forecast leaning bearish. Current signals indicate a price regime of very low volatility, with RSI near neutral at 41. The immediate range remains between 0.088 (support) and 0.092 (resistance). Breaks beyond these levels define near-term targets: >0.092 suggests 0.0939–0.0958; <0.088 suggests 0.0867–0.0849. Overall breadth indicators show weak breadth in the recent window, while Bitcoin’s 24h performance has been negative, contributing to a cautious backdrop for altcoins including DOGE.
Technical Analysis: DOGE
- Current price: 0.0903 (as of report)
- Bias: Downside risk with a sideways tilt expected in the near term
- Key levels
- Major/near support: 0.091 / 0.088
- Major/near resistance: 0.099 / 0.092
- Indicators
- EMA12 < EMA26; SMA50 < SMA200
- RSI: 41 (neutral to mildly bearish)
- Volatility regime: Very low (σ24h ~0.45%)
- Forecast triggers
- Upside trigger: 1h close > 0.092 → target 0.0939–0.0958
- Downside trigger: 1h close < 0.088 → target 0.0867–0.0849
- Invalidation
- Break above 0.099 or below 0.085 would imply a more meaningful shift in near-term direction, but current setup favors range-bound behavior with a bearish tilt.
Drivers
-
- Return 24h: -0.02
- EMA slope: -0.0002
- Funding Z-score: -0.73
- Basis Z-score: 0.36
- Order-book imbalance (EMA5): -0.06
- BTC return 24h: -0.04
- BTC trend strength: 1.46
- Momentum/volatility context
- Vol regime: Very low
- Volatility of volatility: 0.0073 (low)
- Distance from MA: -0.0236 (below, indicating slight underperformance vs major averages)
ETF Flows (BTC/ETH)
ETF flow data provided covers BTC and ETH and is intended to contextualize broader market sentiment. The BTC ETF shows net outflows on the 1D and 5D windows, with a larger positive signal on the 10D window (+$205.4M). ETH ETF data shows smaller outflows on 1D and 5D windows, with positive net on 10D (+$79.5M). These figures are not a direct signal for DOGE but reflect risk-on/off dynamics influencing capital allocation in crypto markets. In this context, negative BTC flows and deteriorating price action can contribute to a cautious tone for altcoins, while extended 10D positive inflows might suggest selective appetite returning over longer horizons.
What to Watch Next
- Watch for a close above 0.092 to confirm near-term upside drift toward 0.0939–0.0958.
- Monitor a break below 0.088 for confirmation of further near-term downside toward 0.0867–0.0849.
- Observe BTC-related flow shifts and BTC price action, as BTC negative momentum can correlate with DOGE weakness in the short term.
- Keep an eye on overall volatility regime; a shift from very low to higher volatility could precede more pronounced directional moves.
Hashtags: #Dogecoin #CryptoMarkets #TechnicalAnalysis #BTCFlows #Altcoins #MarketOverview #TradingStrategy #PriceAction #RSI #EMA #SMA