Market Snapshot
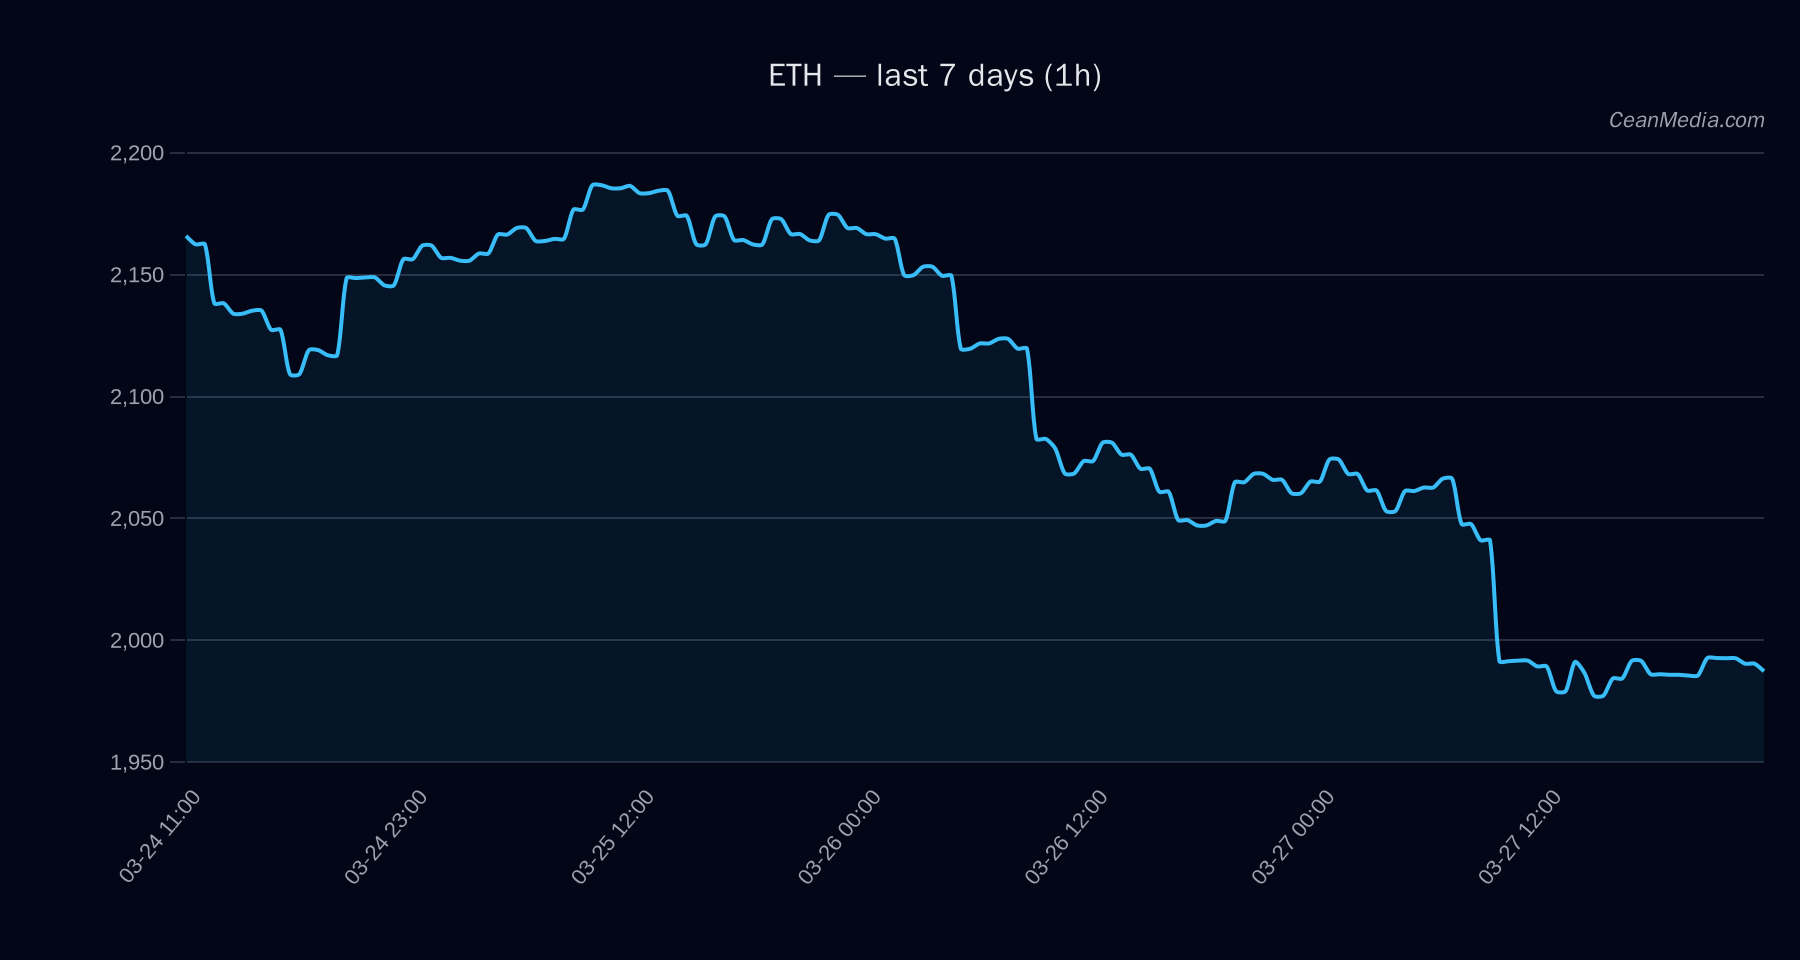
Ethereum (ETH) trades around the 1,988 level, with near-term support and resistance positioned at 1,948 and 2,028 respectively. The broader bands indicate a wide trading range, with a P20–P80 span of 1,786.30 to 2,222.08. The current context shows a low volatility regime (σ24h 0.58%) and a neutral-to-bearish momentum backdrop, despite a placeholder short-term forecast of “up” at 49% probability given the current technical configuration.
Technical Analysis: ETH
- Key levels:
- Major Support: 2,040
- Near Support: 1,948
- Major Resistance: 2,084
- Near Resistance: 2,028
- Bias and triggers: The forecast is described as “up” with 49% probability, but the TA notes remain bearish due to EMA and SMA configurations (EMA12 < EMA26, SMA50 < SMA200) and a relatively low RSI of 34. Break above 2,028 could target 2,068.92–2,109.49; break below 1,948 could target 1,909.83–1,870.86.
- Indicators: RSI 34 indicates oversold conditions; volatility regime is “Very low”. Broad drivers include negative 24h return (-0.04%), negative EMA slope (-0.0005), and negative BTC elements (BTC return -0.04%, BTC trendStrength ~1.77).
- Invalidation: A break above 2,028 with sustained momentum would invalidate the near-term downside bias and open the 2,068–2,109 range, while a break below 1,948 would invalidate the bullish bias and shift focus toward the 1,870–1,909 area.
Drivers
- Top driving metrics include: return 24h (-0.04%), EMA slope (-0.0005), funding Z-score (-1.44), basis Z-score (0.32), and order-book imbalance (EMA5) (-0.046).
- BTC-related factors: BTC return (-0.04%), BTC volatility regime (0), BTC trend strength (~1.77).
- Additional momentum signals: rv_7d (~0.032), trend_strength (~1.38), distance_from_ma (-0.038), drawdown 30d (~-15.8%), breakout_7d (~-0.091).
- Overall sentiment indicators point to a cautious stance with limited upside dispersion in the near term due to very low vol and mixed momentum signals.
ETF Flows (BTC/ETH)
Contextual note: ETF flow data presented here covers BTC and ETH only and should be interpreted as supplementary context rather than a primary signal for ETH price action.
- BTC ETF: 1D -$129.4M | 5D -$158.4M | 10D +$205.4M
- ETH ETF: 1D -$38.9M | 5D -$60.6M | 10D +$79.5M
The current ETF flow pattern shows short-term outflows for both BTC and ETH, with longer-dated frames showing modest inflows for ETH and stronger inflows for BTC in the 10-day window. This may suggest a cautious risk-off backdrop in the immediate term, though the data is not used as a primary signal for ETH movements.
What to Watch Next
- Watch for a decisive close above 2,028 to validate a push toward 2,068–2,109.
- If ETH breaks below 1,948, monitor the 1,909–1,871 range for potential support testing.
- Observe intraday momentum: a sustained RSI move above mid-30s could shift bias; conversely, continued RSI in the low 30s reinforces caution.
- Monitor ETF flow headlines as a contextual risk-off signal, while prioritizing price action and on-chain/order-book indicators for ETH-specific moves.
Hashtags: #ETH #Ethereum #CryptoMarkets #TechnicalAnalysis #ETFFlows #MarketUpdate #PriceAction #Liquidity #SupportResistance #RSI #EMA #SMA