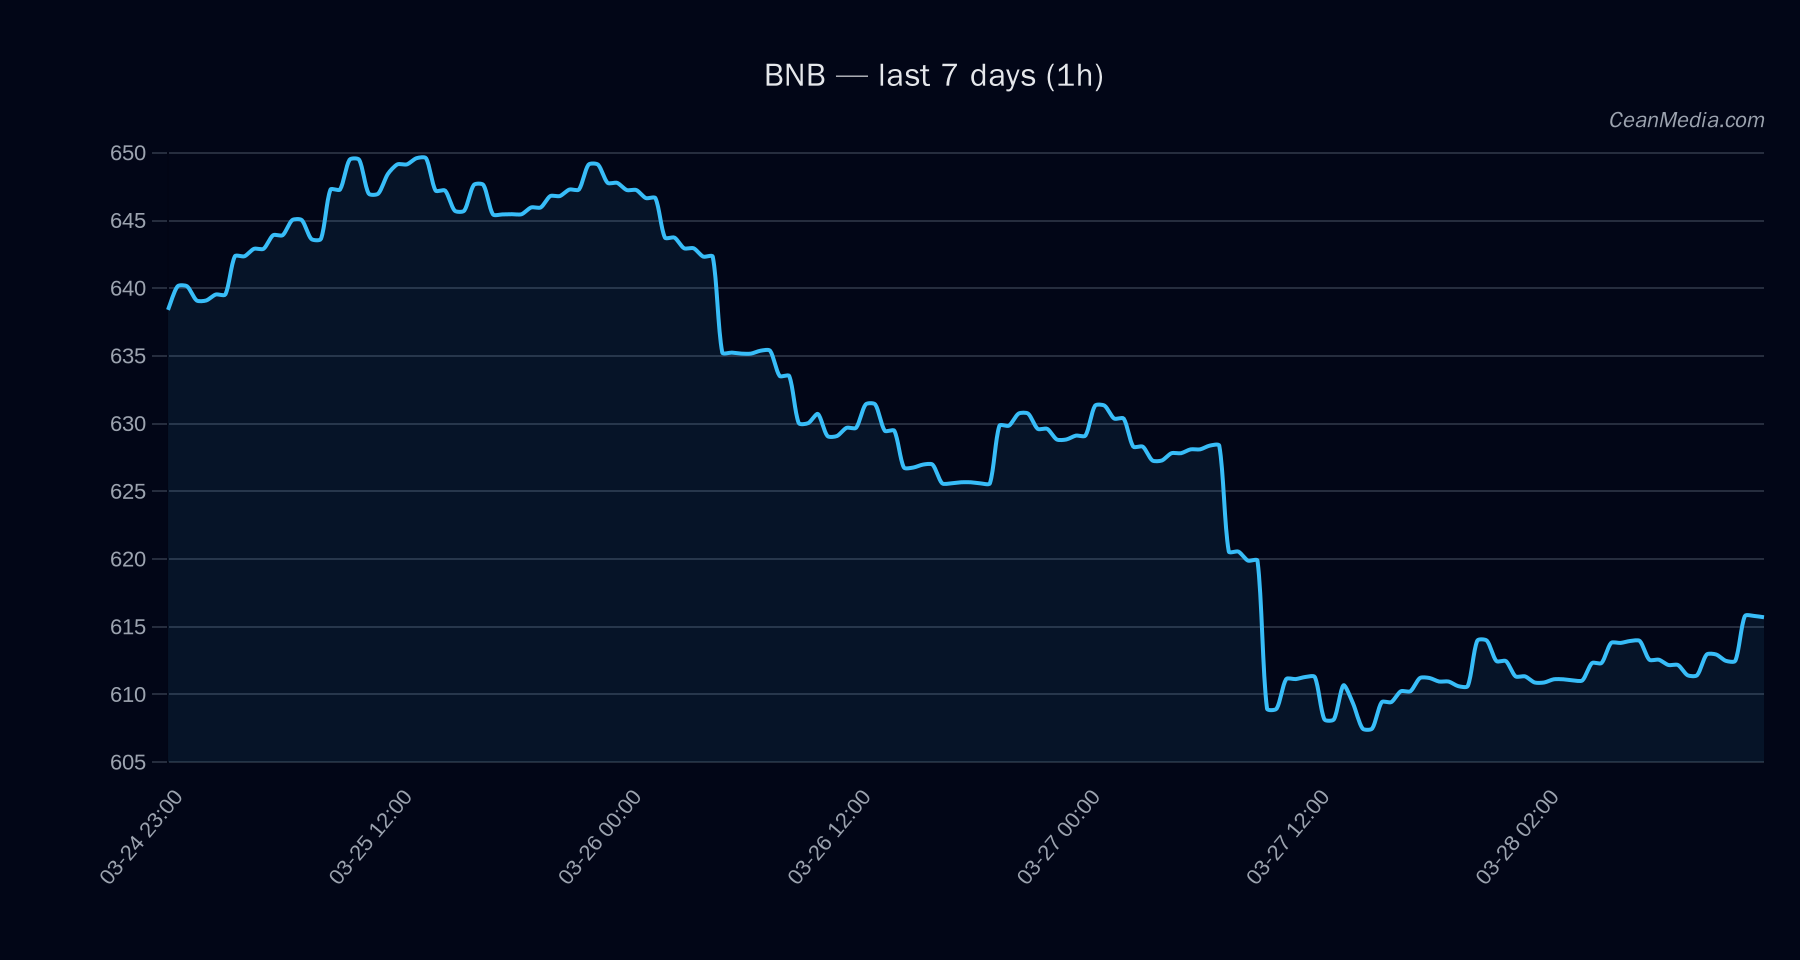
Market Snapshot
BNB is trading near key support and resistance, with a current price around 611.55. Near-term bias is modestly positive on the forecast side (54% probability of an up move), but the setup remains mixed from a traditional TA perspective given the current indicators and very low volatility regime.
Technical Analysis: BNB
Break above 624 (preferably sustained) as a trigger toward 636.26–648.73; break below 599 as a downside invalidation toward 587.33–575.35. - Volume & Momentum: Vol regime: Very low; breadth indicators and momentum signals show muted participation, with BTC-driven dynamics providing occasional directional cues.
Drivers
- Top drivers (numerical impact, 24h): Return 24h = 0.0083; EMA slope = 0.0007; Funding z-score = 0.23; Basis z-score = 0.13; Order-book imbalance (EMA5) = 0.041; BTC return (24h) = 0.011; BTC trend strength = 0.805.
- Market tone: Vol regime remains very low; overall breadth signals are weak (Breadth>50h around 0%). BTC dominance at 56.0% with a slight decline over 7 days; fear index indicates cautious sentiment (Extreme Fear categorization in F&G).
ETF Flows (BTC/ETH)
The ETF flows section covers BTC and ETH only and provides context for macro risk appetite, not a primary signal for BNB. Current data show:
- BTC ETF: 1D -$24.0M; 5D -$130.4M; 10D +$1.0M
- ETH ETF: 1D -$16.7M; 5D -$35.3M; 10D +$28.5M
Interpretation: The latest ETF data reflect a cautious to risk-off stance in the broader crypto complex, with short-term outflows in BTC and ETH. This context can influence cross-asset correlations and risk sentiment, but it is not a direct signal for BNB movements. Investors should treat ETF flows as supplementary context rather than a primary driver for BNB positioning.
What to Watch Next
- Monitor a sustained move above 624 to confirm potential upside toward 636.26–648.73.
- Watch for a break below 599 to assess downside risk toward 587.33–575.35.
- Observe volume changes and any shift in EMA/SMA crossovers (shorter-term EMA12 vs EMA26, SMA50 vs SMA200) for a momentum read.
- Cross-asset context: correlate with BTC/ETH ETF flow signals for any risk-on/off shifts that could impact correlated assets.
Hashtags: #BNB #CryptoAnalysis #TechnicalAnalysis #ETFFlows #BTC #ETH #MacroCrypto #MarketSnapshot #TradingStrategy #RiskManagement #CryptoSignals
Note: ETF data shown here cover BTC and ETH only and are provided for contextual understanding of market risk appetite; they should not be taken as signals for BNB trading decisions.