Market Snapshot
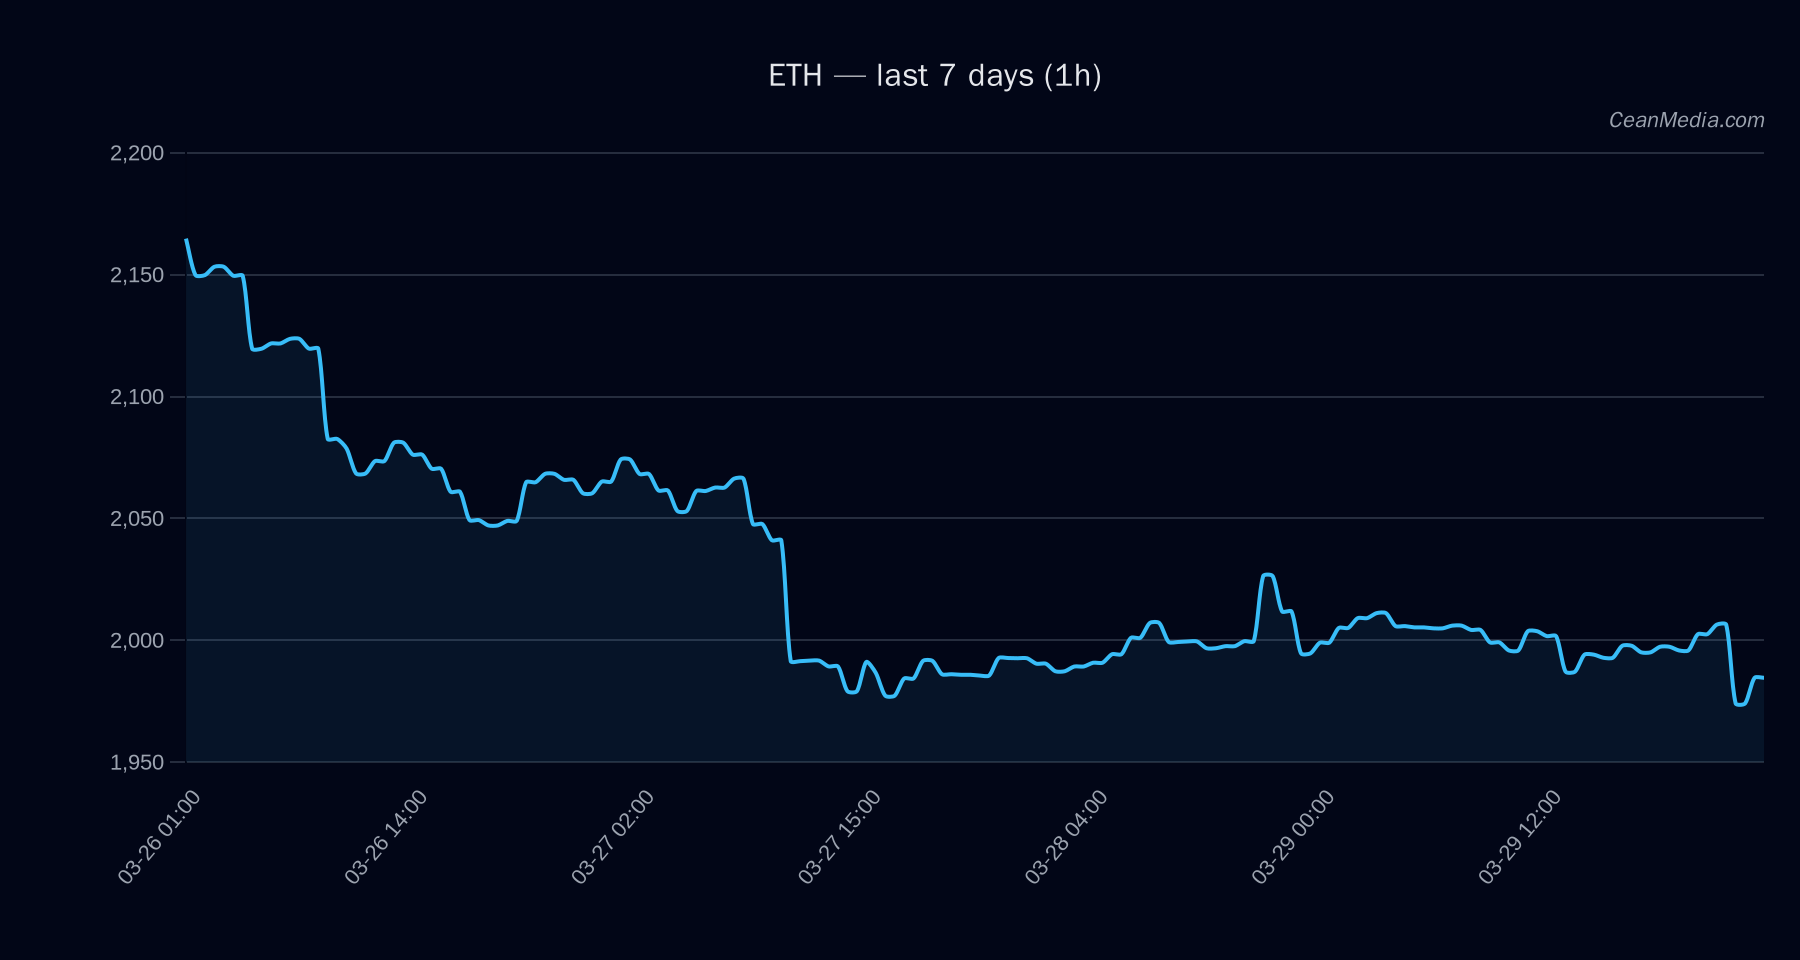
ETH trades around the 2,000 level with a range-bound profile as markets digest macro cues and on-chain signals. The immediate band sits between support near 1,972 and resistance near 2,052, with a potential upside breakout above 2,052 pointing toward 2,093–2,134 and a downside extension below 1,972 targeting 1,932–1,892.
Technical Analysis: ETH
- Price: 2,011.47
- Short-Term Forecast: Up (49%)
- Bias signals: EMA12 < EMA26, SMA50 < SMA200 indicating bearish breadth in trend signals; RSI at 55 indicates neutral momentum.
- Volatility: σ24h 0.56% with very low volatility regime.
- Key Levels:
- Support — Major: 2,004
- Support — Near: 1,972
- Resistance — Near: 2,052
- Resistance — Major: 2,148
- Forecast Scenarios:
- Upside Path: If 1h close > 2,052, target 2,092.73 to 2,133.77.
- Downside Path: If 1h close < 1,972, target 1,931.82 to 1,892.39.
- Invalidation: Break below 1,892 would weaken the near-term constructive view; a break above 2,148 would re-target higher levels beyond the current 2,133.77 zone.
Drivers
- Return 24H: -0.50%
- EMA Slope: Slightly negative
- Funding Z-Score: -0.41
- Basis Z-Score: -1.18
- Order-Book Imbalance (EMA5): -0.31
- BTC Return 24H: -0.55%
- BTC Vol Regime: Very low to neutral
- BTC Trend Strength: 0.33
- Context signals: Breadth>50h at 67%, alt breadth ex-mega at 50%, volatility regime very low, Fear/Greed index extremely Fearish, BTC.D around 56% with a slight decline over 7 days.
ETF Flows (BTC/ETH)
Contextual note: ETF flow data presented here covers BTC and ETH ETFs only and should not be treated as a primary signal for ETH price action. It provides a broader risk-on/off backdrop and potential price impact through correlated flows.
: 1D -$225.5M, 5D -$331.9M, 10D -$200.5M - ETH ETF: 1D -$47.6M, 5D -$66.2M, 10D -$2.4M
The data suggests net outflows in BTC-oriented ETFs over short to medium horizons, with ETH ETF flows also negative but on a smaller scale. This pattern may reflect risk-off sentiment or reallocations across crypto products in the near term, rather than a direct signal for ETH’s fundamentals.
What to Watch Next
- Watch for a daily close above 2,052 to validate the upside trigger toward 2,093–2,134.
- Monitor 1,972 as a near-term safeguard; a daily close below could accelerate a move toward 1,892–1,932.
- Keep an eye on BTC ETF flows for any shift toward risk-on risk-off sentiment that could influence ETH correlations.
- Observe changes in volatility regime; a shift from very low to higher volatility could compress or expand the current band.
Hashtags: #ETHMacro #ETHTechnical #CryptoMarkets #ETFFlows #BitcoinCorrelation #MarketSentiment #TechnicalAnalysis #CryptoNews #TradingStrategy #RiskManagement #BTCETHAlignment