Market Snapshot
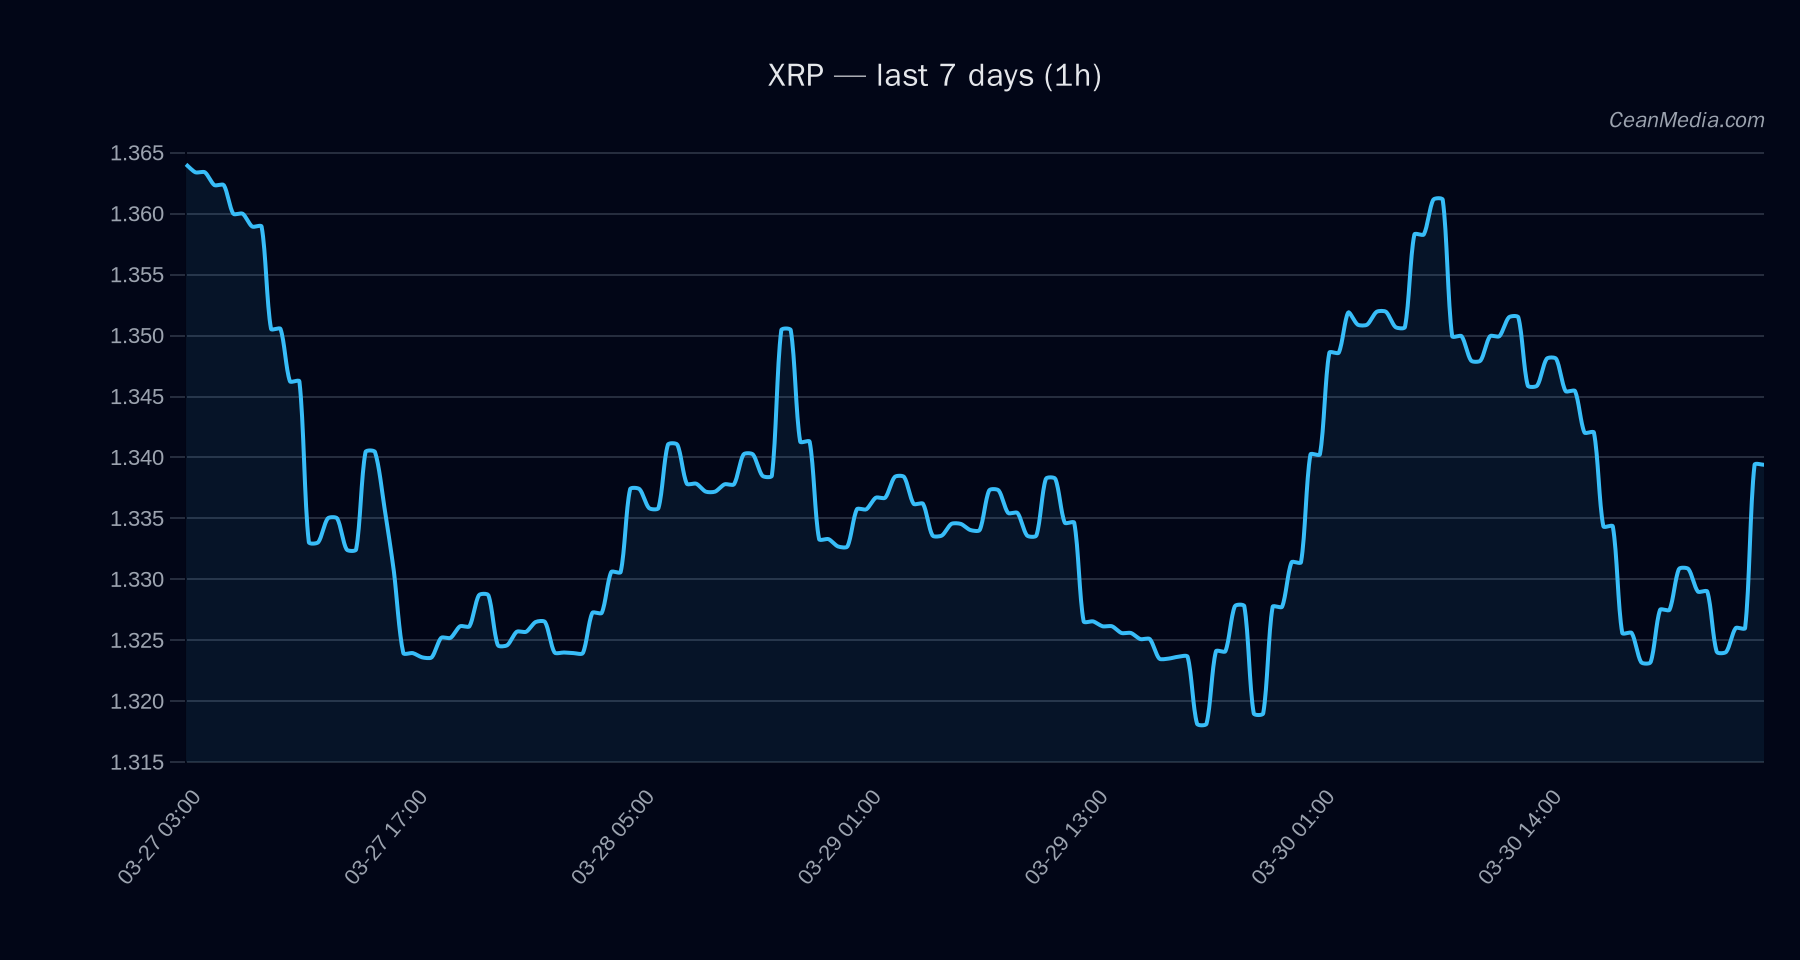
Price on XRP is trading around 1.337, with near-term indicators signaling a bearish tilt in the immediate horizon. The asset sits between a major support of 1.34 and a near-term resistance of 1.36. Breaks above or below these levels define the projected trajectory to the upside or downside bands labeled in the analysis.
Technical Analysis: XRP
- Support (Major): 1.34
- Support (Near): 1.32
- Resistance (Near): 1.36
- Resistance (Major): 1.46
1.2652 – 1.3846 - Upside trigger: 1h close above 1.36 targets 1.3908–1.4181
- Downside trigger: 1h close below 1.32 targets 1.2839–1.2577
Very low volatility regime; EMA12 shows bearish cross (EMA12 < EMA26) with SMA50 < SMA200; RSI 51 indicating neutral momentum. Probability up 42%, sideways 12%, down 46% over the next 24 hours; overall trend is bearish with a narrow trading band.
Drivers
- Return 24h: -0.0006
- EMA slope: +0.0008
- Funding Z-score: +0.07
- Basis Z-score: -0.37
- Order-book imbalance (EMA5): -0.0008
- BTC Return 24h: +0.019
- BTC Vol Regime: 0
- BTC Trend Strength: 0.90
ETF Flows (BTC/ETH)
Contextual market data indicates ETF flows for BTC and ETH are negative over recent periods: BTC ETFs show large outflows (-$225.5M 1D, -$331.9M 5D, -$200.5M 10D); ETH ETFs also exhibit outflows (-$47.6M 1D, -$66.2M 5D, -$2.4M 10D).
Important: ETF data presented here relates to BTC and ETH only and is intended as market context. It is not a primary signal for XRP. The XRP narrative remains driven by its own technicals and on-chain/market microstructure signals; ETF flows are supplementary information for risk sentiment assessment.
What to Watch Next
- Monitor 1.36 resistance for a potential breakout; a sustained close above this level could shift the bias toward a higher target range (1.3908–1.4181).
- Watch 1.32 support for confirmation of downside continuation toward 1.2839–1.2577 in the event of a break below.
- Keep an eye on BTC price action and volatility regime as a supplementary risk-on/off signal, though XRP-specific moves should be weighed primarily from XRP technicals.
- Assess any shifts in EMA/SMA crossovers and RSI momentum that could precede a more meaningful directional change.
Hashtags: #XRP #CryptoAnalysis #TechnicalAnalysis #BTCFlows #ETHFlows #MarketSnapshot #TradingStrategy #XRPForecast #CryptoOutlook #RiskOn #PriceLevels