
Market Snapshot
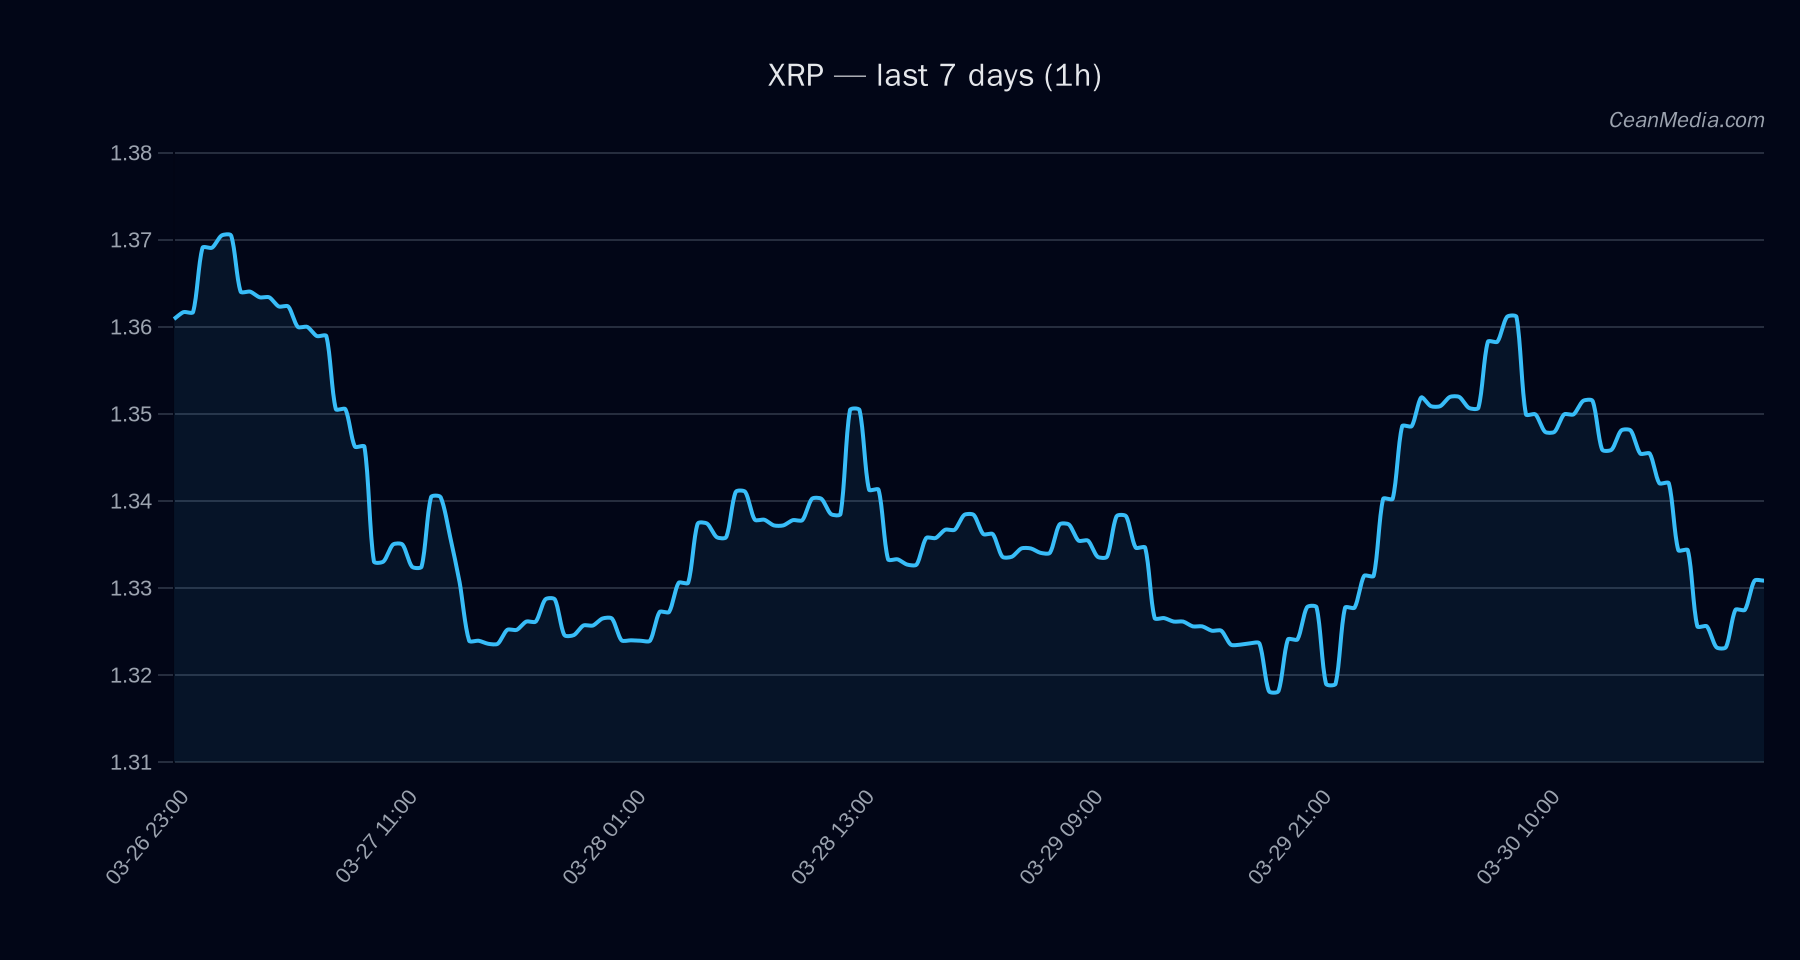
Price: 1.3294. The current read for XRP indicates a bearish short-term tilt with a 46% probability of downside given the price action vicinity to key levels. The band, volatility, and breadth depict a very low regime with subdued momentum.
Technical Analysis: XRP
: Bearish short-term bias. EMA12 is below EMA26 and SMA50 is below SMA200, confirming negative technical alignment. RSI at 41 indicates modest downside pressure but not oversold. - Trading Range and Levels:
- Support (Major): 1.34
- Support (Near): 1.30
- Resistance (Major): 1.46
- Resistance (Near): 1.36
- Band (P20–P80): 1.2512 – 1.3721
- Forecast: 24-hour horizon indicates DOWN with a probability around 46.0%. Up probability ~42.0%, sideways ~12.0%. The 1-hour trigger: a close above 1.36 could open a path toward 1.3831–1.4102; a close below 1.30 could target 1.2768–1.2507.
- Trends and Momentum: EMA slope negative (EMA12 < EMA26), trend divergences modest with RSI in neutral territory. Vol regime is described as very low, indicating limited intraday swings.
- Open Considerations: Breakout/Breakdown thresholds should be monitored around 1.36 and 1.30 for short-term decision points.
Drivers
- Return 24H: +0.23%
- EMA Slope: negative (-0.0007)
- Funding Z-Score: 1.23
- Basis Z-Score: -0.30
- Order-book Imbalance (EMA5): -0.02
- BTC Return 24H: +0.15%
- BTC Vol Regime: 0
- BTC Trend Strength: 0.06
Context metrics show breadth above 50h at 17%, BTC dominance at 56.0% (down 0.5percentage points over 7 days), and a very low volatility regime. Fear/Greed indicators suggest caution with broader market sentiment leaning into risk-averse conditions.
ETF Flows (BTC/ETH)
The ETF flow data provided pertains to BTC and ETH rather than XRP. BTC ETFs show notable negative flows: -$225.5M (1D), -$331.9M (5D), -$200.5M (10D). ETH ETFs show -$47.6M (1D), -$66.2M (5D), -$2.4M (10D). These figures should be interpreted as context for risk appetite and capital allocation in the crypto ecosystem, not as a direct signal for XRP. In essence, broader ETF outflows in BTC/ETH suggest risk-off conditions, which can weigh on risk assets including XRP, though XRP-specific factors remain the primary drivers for XRP pricing.
What to Watch Next
- Monitor XRP price action around 1.36 (near resistance) and 1.30 (near support) for potential breakout or breakdown triggers.
- Watch for a close above 1.36 to validate a potential move toward 1.3831–1.4102 in the short term.
- Observe ETF flow shifts in BTC/ETH as a contextual risk signal; sustained outflows may reinforce risk-off sentiment impacting XRP indirectly.
- Keep an eye on BTC trend strength and volatility regime, as cross-asset correlations can reassert with macro-driven moves.
Hashtags: #XRP #CryptoAnalysis #TechnicalAnalysis #Bitcoin #Ethereum #ETFFlows #MarketStructure #TradingLevels #CryptoNews