Market Snapshot
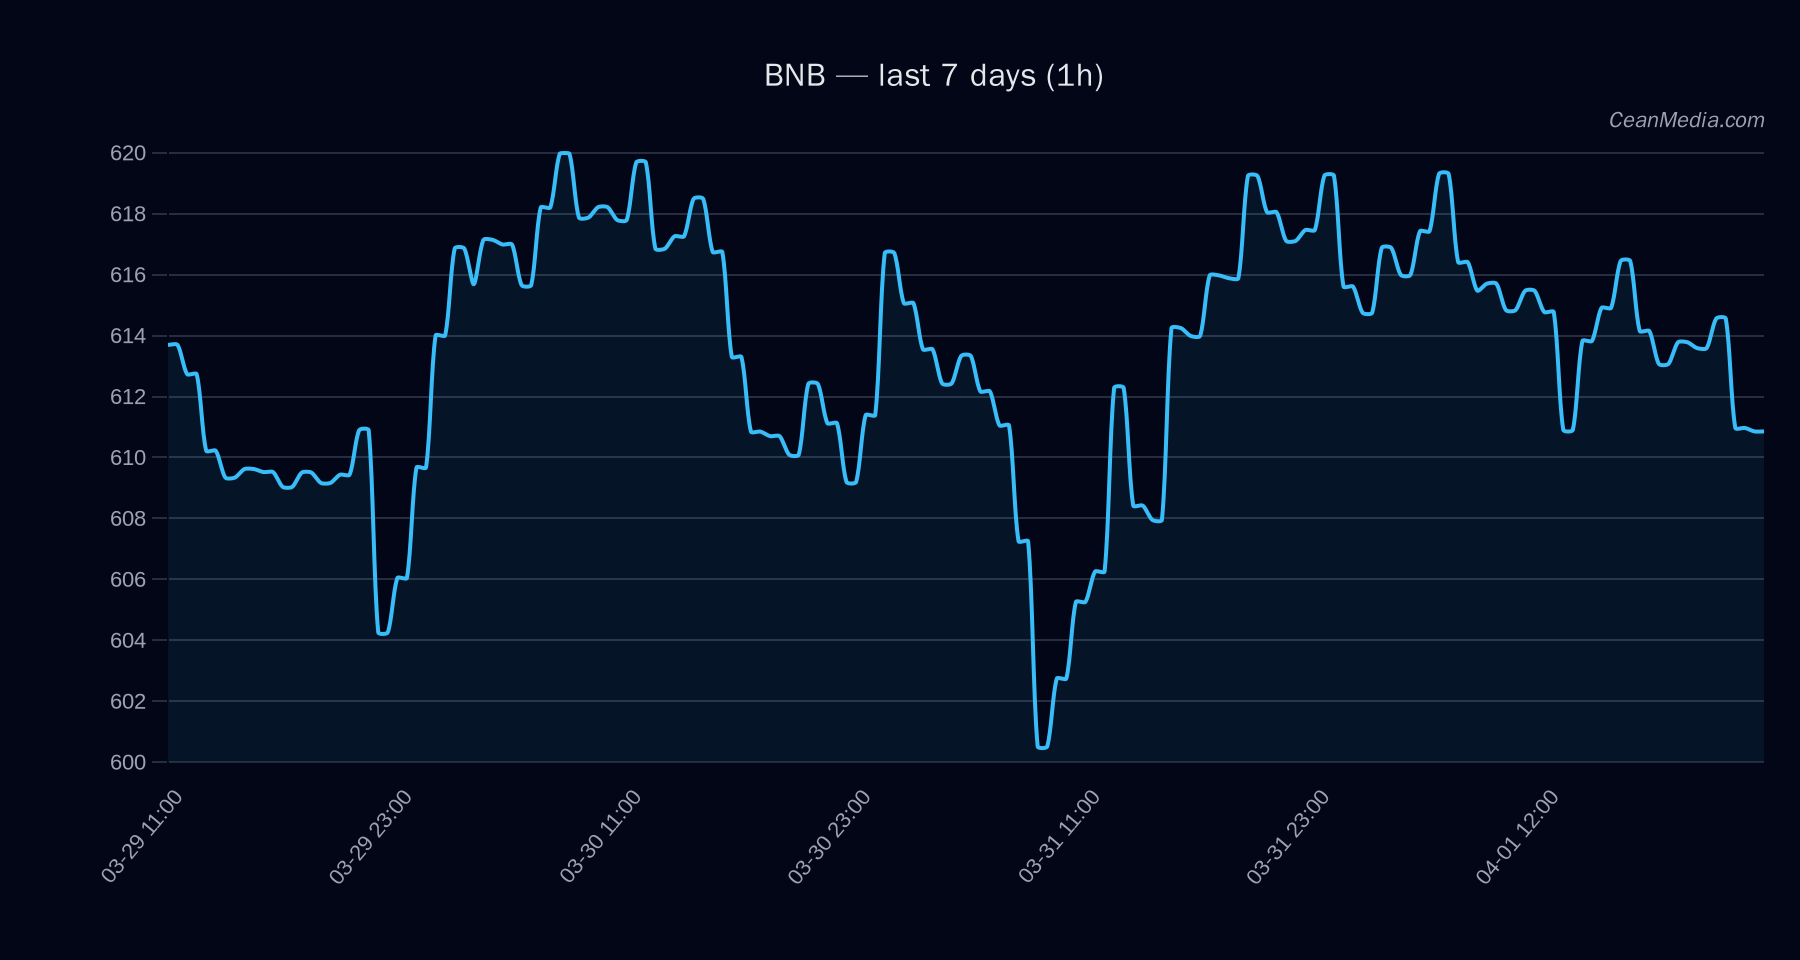
As of 2026-04-02, BNB trades near key support and resistance with a cautious near-term bias. The current price is around 611.77, with a band tightness indicating low volatility. Broad market context shows elevated breadth readings and mixed risk sentiment, while BTC and ETH ETF flows provide ancillary market temperature signals.
Technical Analysis: BNB
Key levels:
- Major Support: 611 (Near: 600)
- Major Resistance: 641 (Near: 624)
- Band (P20–P80): 582.65 – 624.23
Bias and setup: Forecast is up (50% probability) with TA describing a bearish tilt on classic crossovers: EMA12 < EMA26 and SMA50 < SMA200. RSI at 45 indicates neutral momentum. Volatility regime is described as very low (σ24h ≈ 0.31%), suggesting a consolidation backdrop.
Triggers:
- Upside trigger: 1h close > 624 targets 636.49 – 648.97
- Downside trigger: 1h close < 600 targets 587.54 – 575.55
Invalidations: A move below the near-term 600 level would validate a more pronounced corrective scenario, increasing the risk of a deeper pullback toward the 575–587 region in the described band.
Drivers
- Top drivers (relative contribution):
- DEPTH USD 10BP LOG1P: -1.19 (value 14.44)
- TBI REL: 0.87 (value 1)
- RV 24H: 0.74 (value -0.7)
- RV 7D: 0.62 (value -0.7)
- SPREAD BP: 0.52 (value 0.9)
- FUNDING Z-SCORE: 0.47 (value 0.43)
Additional context indicators show breadth above 50% (67%), BTC-USD 72h correlation of 0.89, and a very low volatility regime. Fear index (F&G) sits at 12, signaling Extreme Fear in broader markets, while BTC.D stands at 56.2% and is edging lower over 7 days. These inputs are contextual and do not override the BNB-specific TA above.
ETF Flows (BTC/ETH)
ETF flow data provided here is limited to BTC and ETH and is intended as market context rather than a primary signal for BNB. Current read shows:
- BTC ETF: +$117.5M (1D); -$97.0M (5D); -$419.9M (10D)
- ETH ETF: +$30.0M (1D); -$28.3M (5D); -$146.6M (10D)
Interpretation: The near-term BTC/ETH ETF signals reflect a mixed to modest risk-on backdrop in the crypto ecosystem, with notable one-day inflows counterbalanced by multi-day outflows. This context can support general liquidity but is not a primary driver for BNB, which should be weighed against its own TA and on-chain signals.
What to Watch Next
- Monitor 1h close relative to 624 resistance for potential breakout toward 636–649.
- Watch for a break below 600 to assess downside risk toward the 575–587 zone.
- Assess changes in volatility regime; a shift from very low could precede more pronounced moves.
- Keep an eye on BTC/ETH ETF flow shifts as corroborative market context, not primary signal for BNB.
Hashtags: #BNB #CryptoAnalysis #TechnicalAnalysis #MarketSnapshot #ETFFlows #BTC #ETH #AltCoins #CryptoStrategy #MacroCrypto #TradingView #MarketCommentary