Market Snapshot
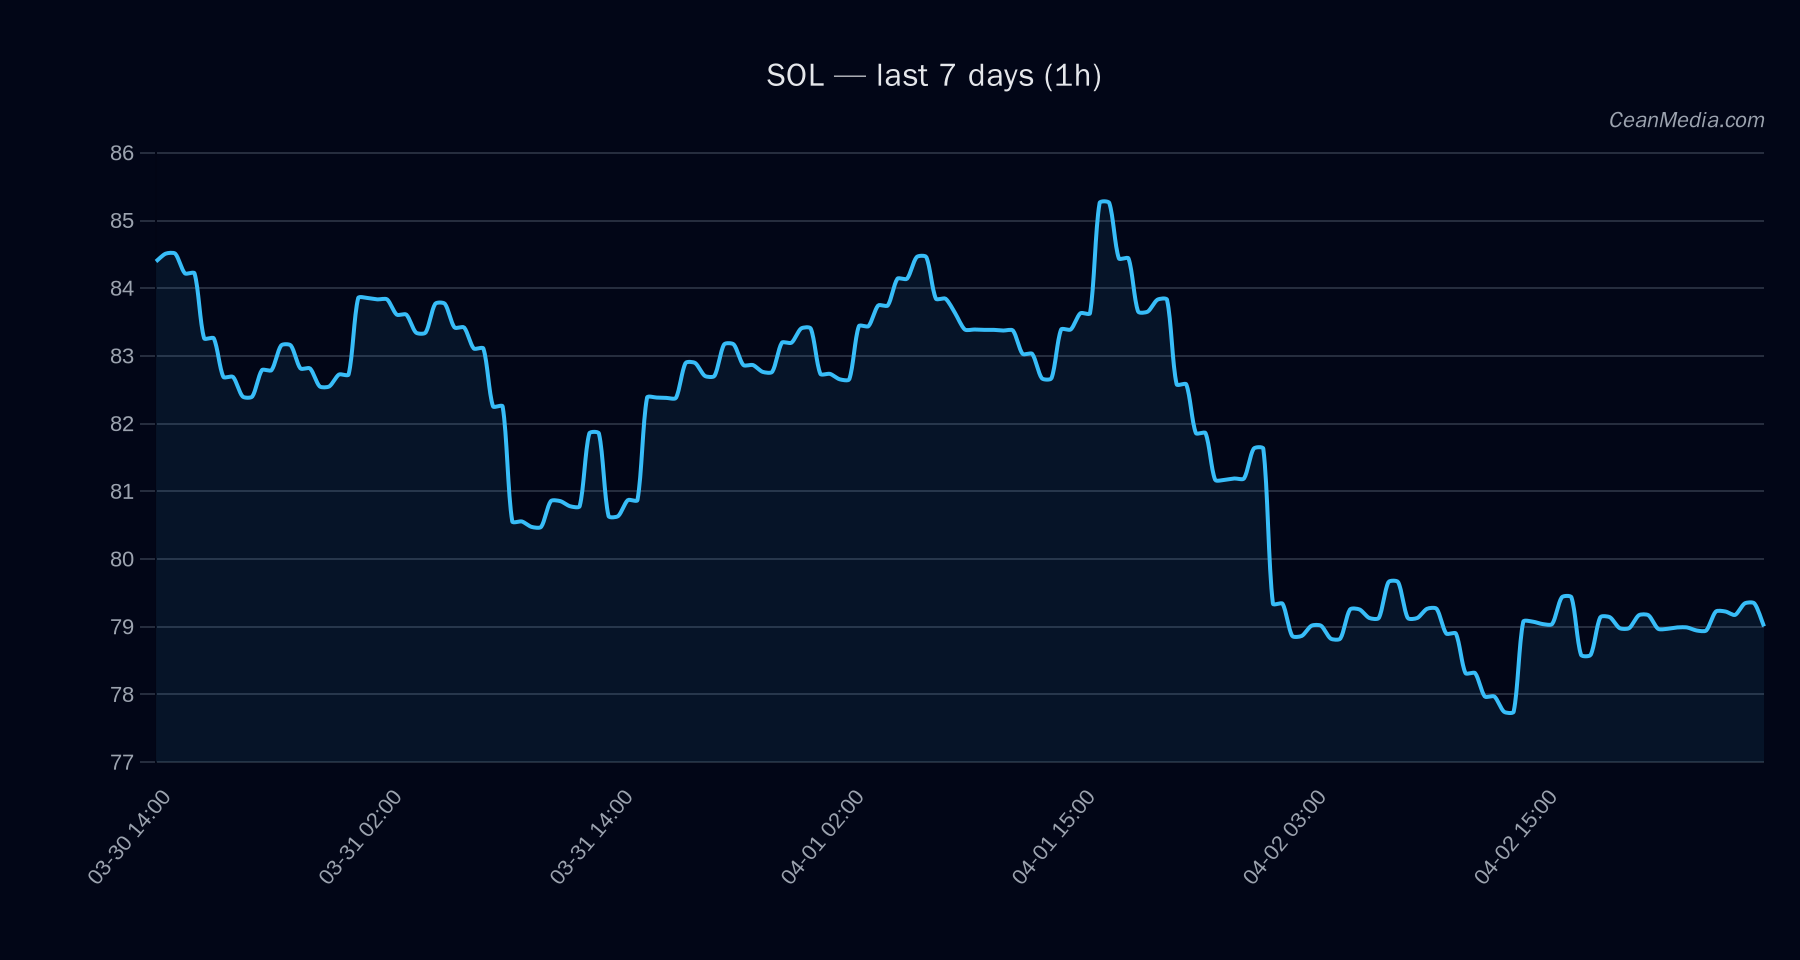
On 2026-04-03, SOL trades around the mid-80s range with a current price near 79.27. The immediate setup shows SOL oscillating between key support and resistance levels, with upside potential if near-term resistance is breached and downside risk if the price breaks below support. Broad market signals indicate very low volatility and a cautious trading regime with extended breadth readings not supporting a strong directional bias from market breadth alone.
Technical Analysis: SOL
up (51%) P20–P80: 73.30 – 85.25 1h close > 80.9 → 82.47 – 84.09 1h close < 77.7 → 76.13 – 74.58 Bearish TA signals (EMA12 Very low
Contextual triggers to monitor include a close above 80.9, which would target the 82.47–84.09 zone, and a break below 77.7, which would open a path toward 76.13–74.58. The forecast assigns a 51% probability to an upside move over the near term, with risk factors as noted in the drivers section.
Drivers
EMA slope, BASIS Z-score, FUNDING Z-SCORE, and OBImbalance (EMA5) LIQ IMB Z-SCORE and DEPTH USD 10BP LOG1P contribute negatively to the short-term momentum (contrib values shown in the report) DISTANCE FROM MA and TBI Z-SCORE provide mixed inputs, with modest negative distance from MA and a negative TBI contribution observed
Overall, the momentum indicators show a cautious posture with a slight tilt toward upside if near-term resistance holds above key level 80.9, but underlying TA remains bearish due to EMA/SMA cross-conditions and RSI in the mid-40s.
ETF Flows (BTC/ETH)
The ETF flow context provided covers BTC and ETH, not SOL directly. Current figures show: BTC ETF +$12.0M on 1D, -$121.3M on 5D, -$279.7M on 10D; ETH ETF -$23.6M on 1D, -$27.9M on 5D, -$88.5M on 10D. This context should be interpreted as general market risk sentiment and liquidity shifts that can influence risk assets broadly, including SOL. It is explicitly stated that ETF data is context only and not a primary signal for SOL pricing. In periods of risk-on appetite, BTC/ETH ETF inflows can support broader risk assets; conversely, ETF outflows can accompany risk-off conditions. The current data suggests a skeptical to cautious stance in the broader crypto market, which may weigh on momentum for altcoins in the near term.
What to Watch Next
- Watch for a daily close above 80.9 to validate the upside trajectory toward 82.47–84.09.
- Monitor a break below 77.7 for potential move toward 74–76 region.
- Track liquidity indicators and vol regime (very low) as they can amplify whipsaws around key levels.
- Keep an eye on BTC/ETH ETF flows as a contextual signal for overall risk appetite (not SOL-specific).
Hashtags: #SOL #Solana #CryptoAnalysis #TechnicalAnalysis #ETFFlows #BTC #ETH #MarketSnapshot #CryptoNews #Altcoins #RiskOn #Trading