Market Snapshot
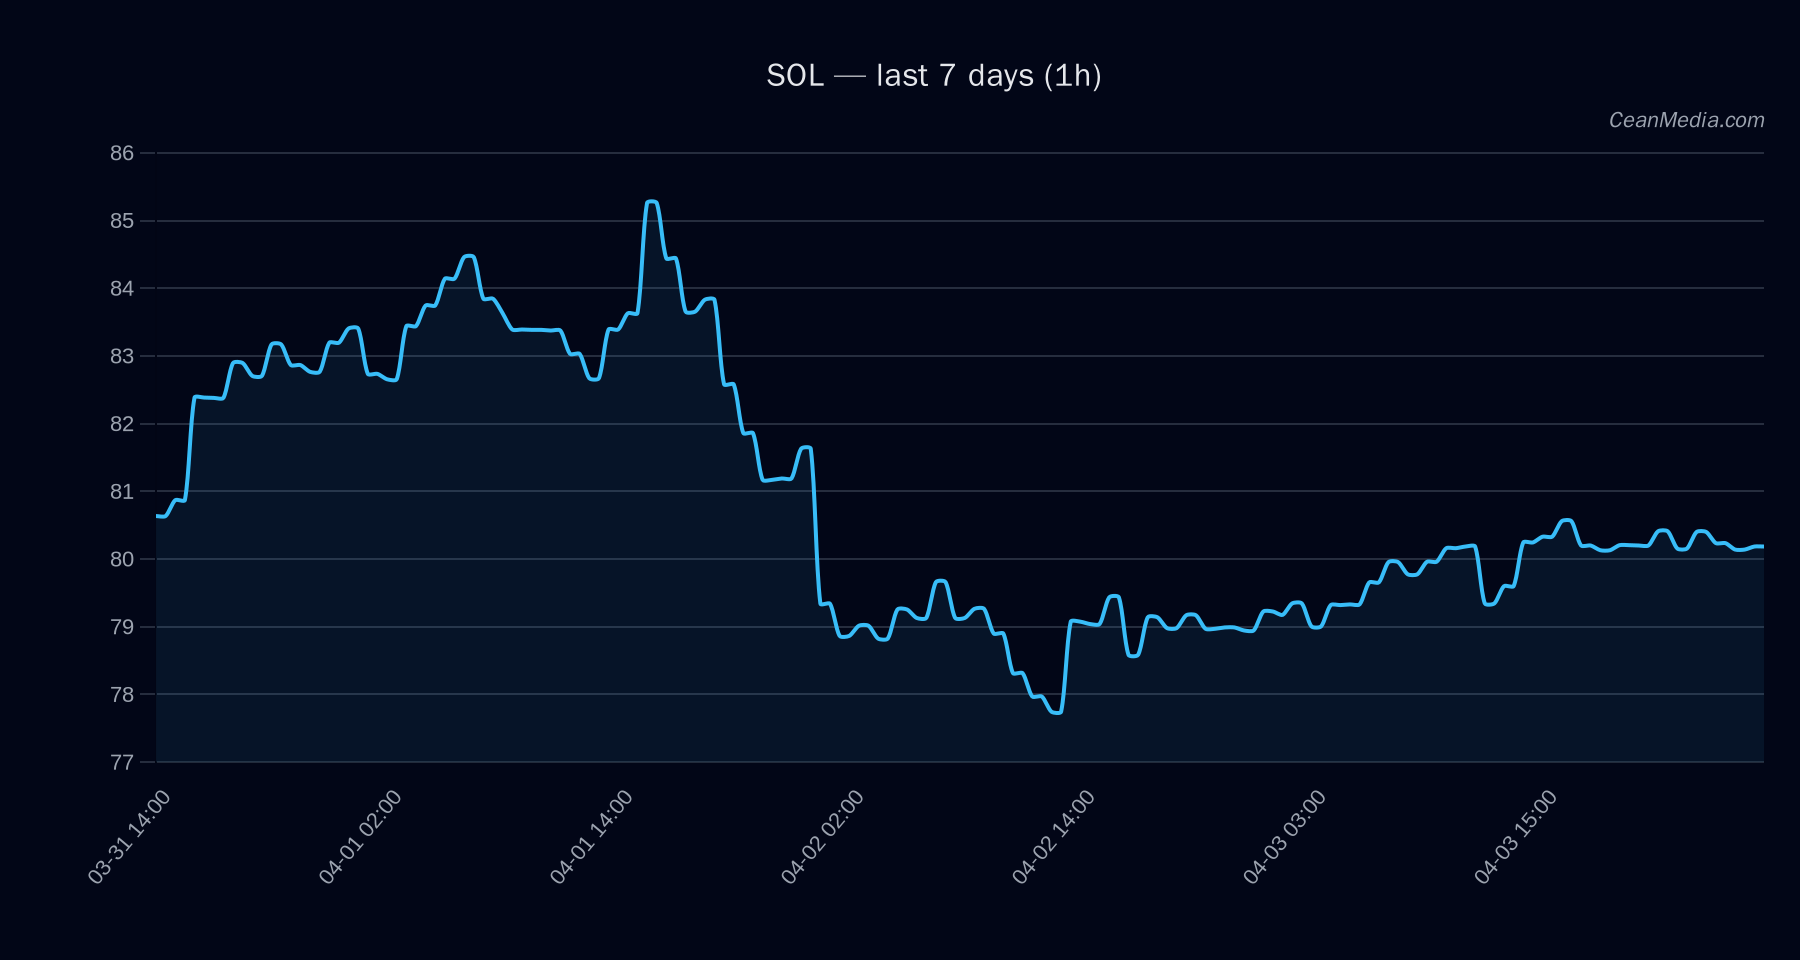
Solana (SOL) sits within a tight trading range near notable support and resistance levels. The current price is around 80.18, with a short-term forecast indicating a potential upside bias. Market breadth remains positive, and volatility is characterized as very low.
Technical Analysis: SOL
- Key levels: Support (Major) at 80.2; Near-term support at 78.6. Resistance (Major) at 84; Near-term resistance at 81.8. A break above 81.8 targets 83.42–85.05; a break below 78.6 targets 77.00–75.43.
- Bias and indicators: Forecast is “up” with a 50% probability in the near term. TA signals show EMA12>EMA26, SMA50
- Momentum and range: Band (P20–P80) spans 75.31–85.89, suggesting a wide but balanced distribution within the current range. Upside projection for a close above 81.8 points to a range of roughly 83.42–85.05.
- Intra-range triggers: Break > 81.8 implies continued upside; break < 78.6 implies downside pressure toward 75.43–77.00.
Drivers
Depth USD 10bp log1p (-1.72), Spread BP (+1.25), BTC RV 24H (-1.14), BTC Vol Regime (-1.53), LIQ IMB Z-SCORE (-2.26 to +0.52 depending on metric), RV 24H (+0.99). BTC trend strength 0.48, RV 7d 0.03, trend strength 0.57, distance from MA -0.42% (slightly below MA), drawdown 30d -16.8%. The top drivers indicate a mix of on-chain/market microstructure signals with a tilt from liquidity and depth metrics. Volatility remains low, supporting range-bound behavior with a potential uptick on a breakout above 81.8.
ETF Flows (BTC/ETH)
Contextual note: ETF data provided here covers BTC and ETH only and should be viewed as market sentiment context rather than a primary signal for SOL. ETF flows can influence risk appetite and correlated assets but are not a direct driver of SOL price determinism.
1D +$12.0M | 5D -$121.3M | 10D -$279.7M 1D -$23.6M | 5D -$27.9M | 10D -$88.5M
What to Watch Next
- Monitor for a close above 81.8 to validate the upside path toward 83.4–85.1.
- Watch for a break below 78.6 to confirm downside risk toward 75.4–77.0.
- Track BTC/ETH ETF flow momentum as a contextual risk-on/off signal, recognizing it is not a SOL-specific signal.
- Maintain awareness of volatility regime: very low readings can precede bursts if a breakout occurs.
Hashtags: #SOL #Solana #CryptoAnalysis #MarketSnapshot #ETFFlows #BTC #ETH #CryptoMarkets #TechnicalAnalysis #PriceAction #Liquidity