Market Snapshot
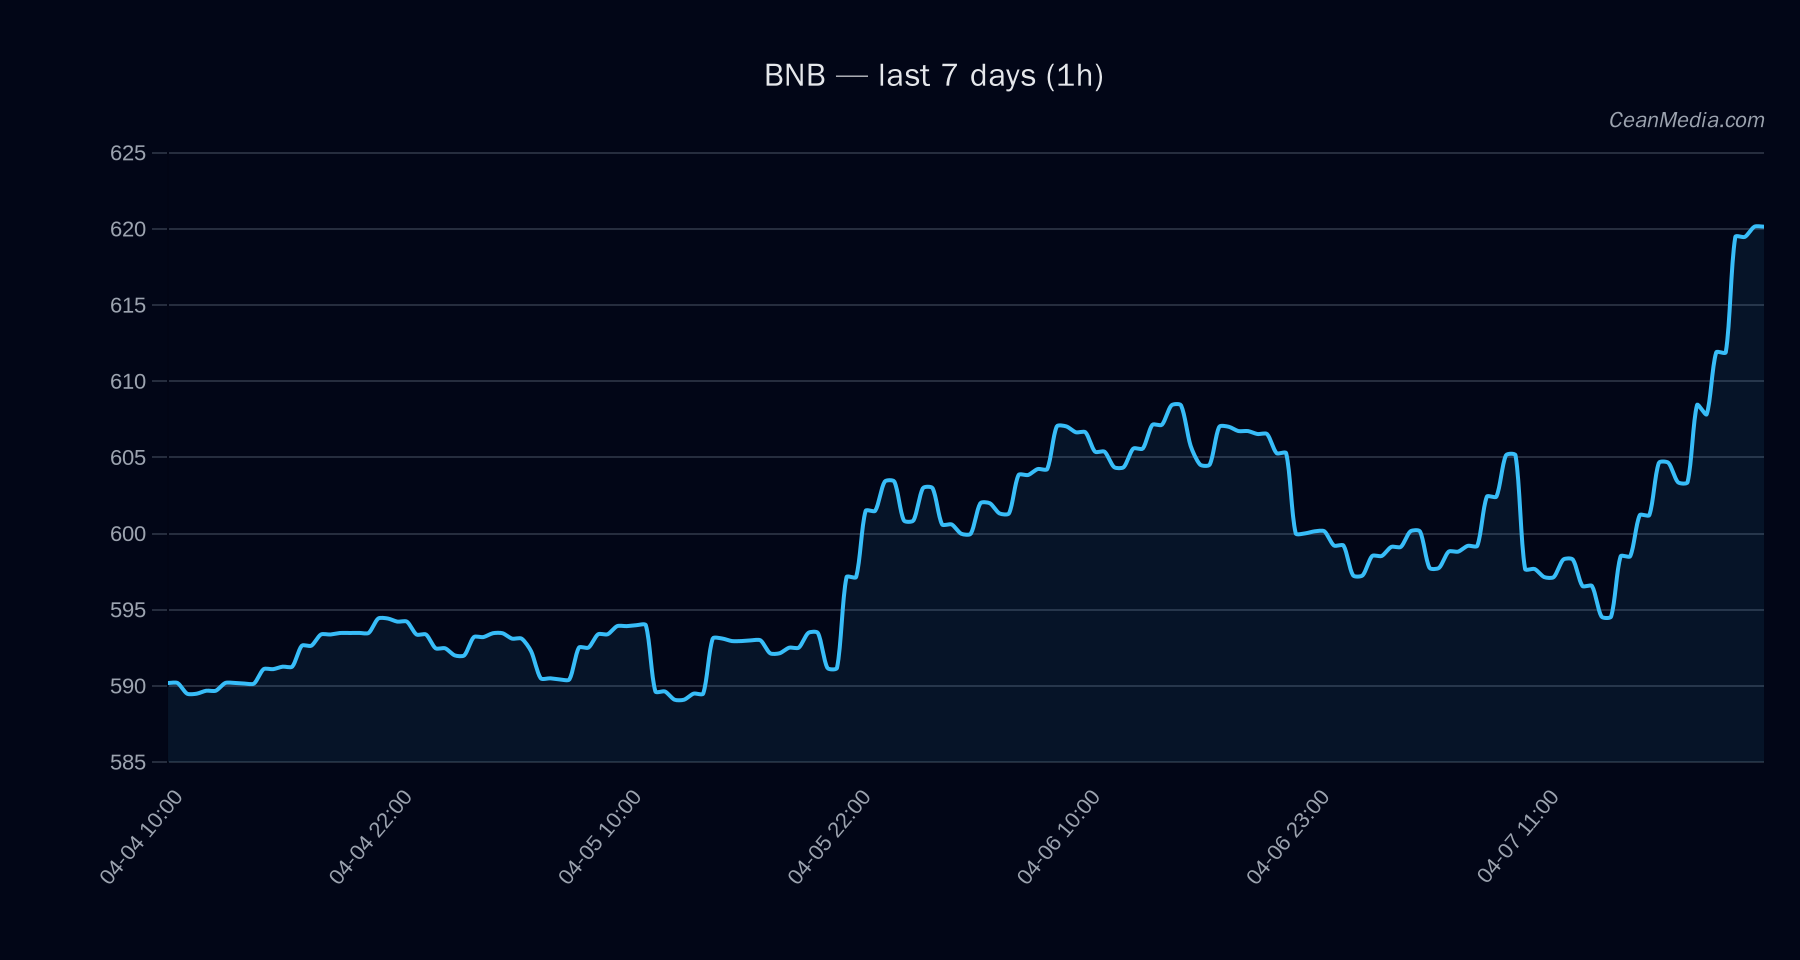
BNB is trading near key support and resistance between 603 and 628, with a price around 615.8. The near-term forecast indicates a DOWN bias (56%), while the overall TA remains bullish on medium-term indicators (EMA12>EMA26; SMA50>SMA200; RSI at 66). The current volatility regime is noted as very low, with a narrow band (P20–P80: 602.45–630.01) and a P50 at 612.72. A break above 628 suggests potential upside toward 640.68–653.24; a break below 603 opens risk toward 591.41–579.34.
Technical Analysis: BNB
Support major 588; near-term support 603. Resistance near 628; major resistance 638. 1h close above 628 targets 640.68–653.24; 1h close below 603 targets 591.41–579.34. A sustained move back above 638 would shift the immediate bias toward a higher-range consolidation; a drop below 588 would accelerate a deeper pullback.
Drivers
Depth USD 10bp log1p (positive), Distance from MA (positive), BTC EMA slope (positive); EMA slope (negative impact), Spread BP (negative). RSI is in neutral-to-bullish territory at 66; volatility regime is very low; breadth is robust (Breadth > 50h: 100%). BTC correlation over 72h remains strong (0.88), alt breadth ex-mega is solid (100%), and overall sentiment indicators show some risk-off/Extreme Fear signals in broader markets.
ETF Flows (BTC/ETH)
ETF flow data provided here covers BTC and ETH only and should be interpreted as contextual market activity rather than a primary signal for BNB. Recent figures show BTC ETFs contributing positive inflows across 1D, 5D, and 10D horizons (+$453.8M, +$555.0M, +$223.1M respectively) and ETH ETFs also showing positive inflows (+$105.8M, +$78.8M, +$12.6M respectively). The data suggests a broader risk-on tilt in crypto markets, which can influence risk sentiment and cash allocation across crypto assets. However, ETF flows are not a direct driver of BNB pricing and should be considered as a contextual factor.
What to Watch Next
- Confirm whether 1h close sustains above 628 to validate immediate upside targets toward 640–653.
- Monitor for a decisive move below 603 which would open the next support zone around 591–579.
- Observe changes in BTC/ETH ETF flows as a backdrop for market risk-on/off sentiment, not as a trigger for BNB trades.
- Keep an eye on RSI behavior around 66–70 and any volatility regime shift that could impact breakouts.
Hashtags: #BNBAnalysis #CryptoMarkets #TechnicalAnalysis #ETFFlows #BTC #ETH #MarketSignals #CryptoTrading #RiskOn #PriceAction #AltMarkets