Market Snapshot
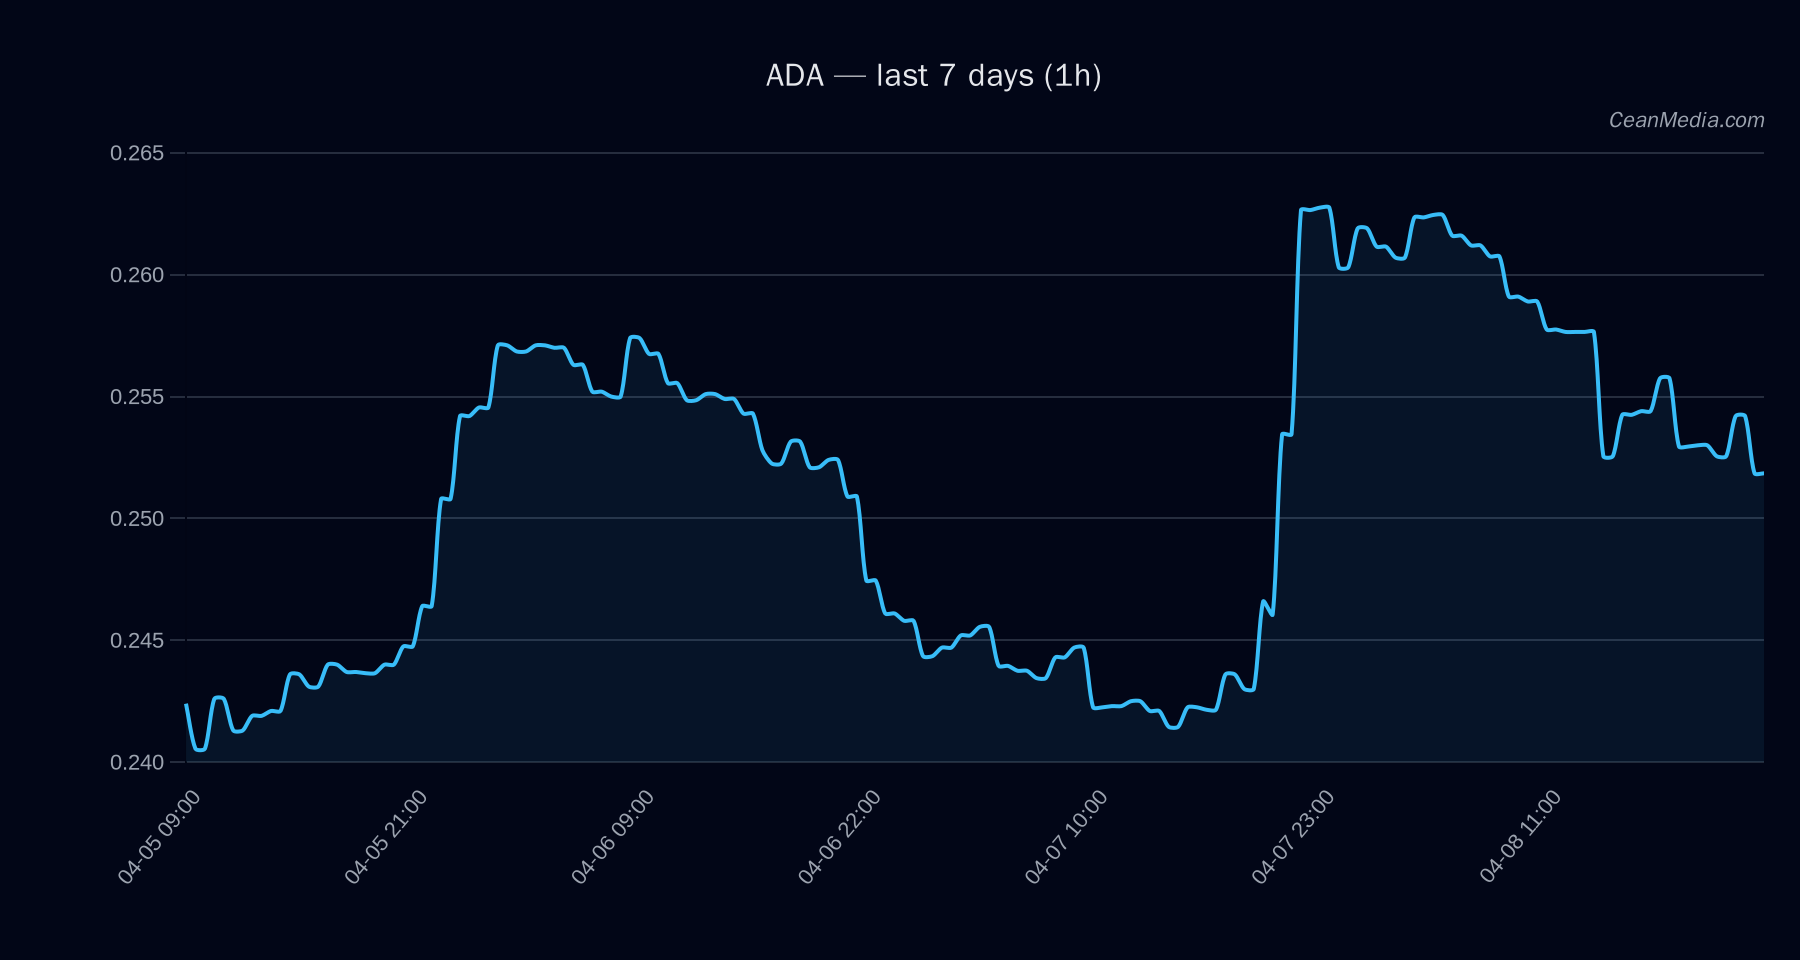
ADA is trading within a tight range near key support and resistance levels. The latest snapshot shows price around 0.25 USD, with a short-term bias leaning toward downside in the 24-hour horizon, while broader indicators point to a sideways-to-down momentum given the current mix of moving averages, volatility, and RSI readings.
Technical Analysis: ADA
0.2507 EMA12 < EMA26, SMA50 > SMA200 signals a bearish tilt in the very near term, combined with a RSI of 40. Very low (σ24h 0.64%) - Major Support: 0.24
- Near Support: 0.245
- Near Resistance: 0.255
- Major Resistance: 0.265
Break above 0.255 targets 0.2608–0.2659; break below 0.245 targets 0.2408–0.2359. Up 42%, Sideways 7%, Down 51% (Overall forecast: down)
Drivers
DEPTH USD 10BP LOG1P contributed positively; SPREAD BP and various Z-scores present mixed influence. EMA slope negative, 24h return around -0.04, and low overall volatility regime.
ETF Flows (BTC/ETH)
Contextual note: ETF flow data here reflects BTC and ETH ETF movements and is provided for market context, not as a primary signal for ADA. The data shows recent activity in BTC and ETH ETFs that can influence risk sentiment and overall market liquidity.
- BTC ETF (1D): -$142.0M
- BTC ETF (5D): +$351.1M
- BTC ETF (10D): +$74.7M
- ETH ETF (1D): -$63.5M
- ETH ETF (5D): +$10.9M
- ETH ETF (10D): -$49.3M
The net directional flow in BTC appears mixed but with recent 5D and 10D data suggesting inflows, which can reflect a cautious risk-on backdrop. ETH shows modest outflows in the near term, contributing to a nuanced market mood. Overall, ETF data is a contextual backdrop and should not be treated as a direct signal for ADA trading decisions.
What to Watch Next
- Monitor for a break above 0.255 to validate a short-term upside path toward 0.2608–0.2659.
- Watch for a break below 0.245 to confirm renewed downside toward 0.2408–0.2359.
- Observe volatility regime and RSI for any divergence that could precede a shift in bias.
- Keep an eye on BTC/ETH ETF flow momentum for broad market risk sentiment signals that could spill into altcoins.
Hashtags: #ADA, #Cardano, #Cryptomarkets, #Altcoins, #TechnicalAnalysis, #MarketOutlook, #ETFFlows, #BTC, #ETH, #CryptoNews, #TradingStrategy