Market Snapshot
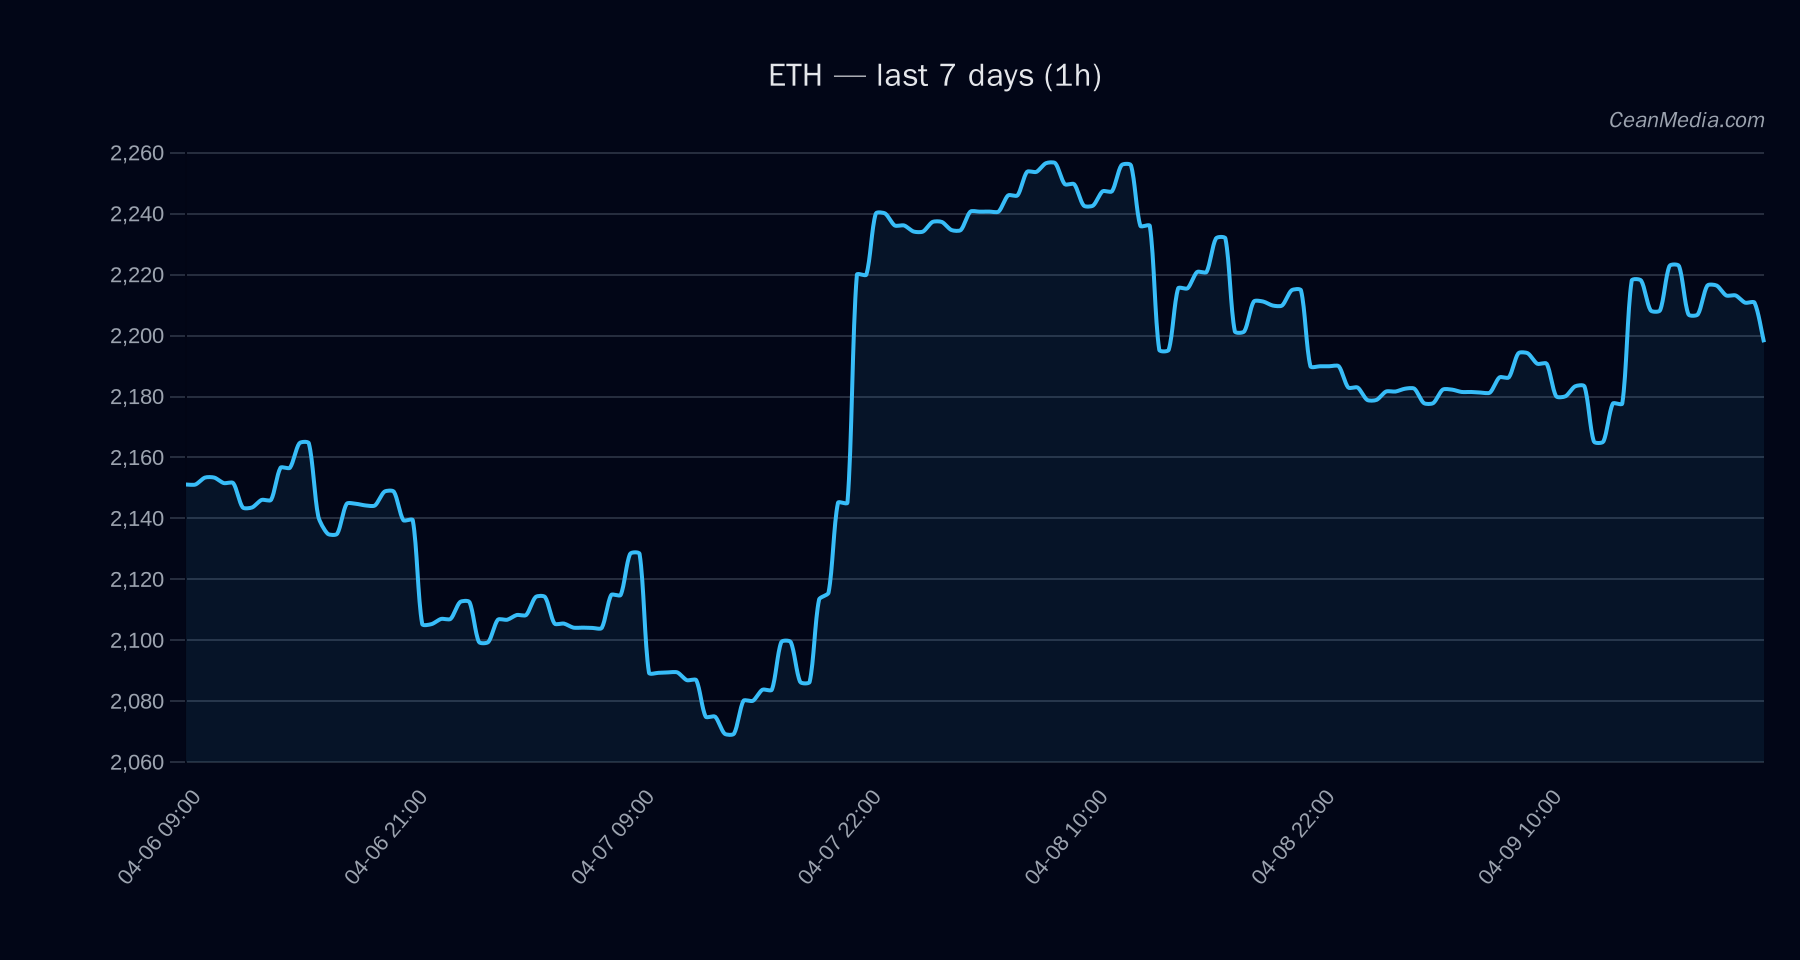
ETH trades near key support and resistance, with a neutral near-term bias. The latest T/A suggests a sideways market with a slight bullish tilt on a break above key resistance and a potential pullback toward support if downside is triggered. Market breadth remains modest, and the volatility regime is characterized as very low.
- Current price: 2,192.63
- Short-term forecast: sideways (8%)
- Probabilities (up/sideways/down): 47% / 8% / 45%
- Volatility regime: Very low; RSI: 48
- Key bands: P20–P80 = 2,031.98 – 2,357.95; Band center around 2,199.52 (P50)
- Major/near-term levels: Support 2,010 / 2,148; Resistance 2,184 / 2,236
Technical Analysis: ETH
Structure: ETH sits between the near-term support at 2,148 and resistance at 2,236. The bias remains bullish on trend structure (EMA12 > EMA26, SMA50 > SMA200) but with subdued momentum (RSI 48). A breakout above 2,236 targets 2,281.21–2,325.94. A break below 2,148 targets 2,105.80–2,062.83.
: - Bullish trigger: 1h close > 2,236 (>2,281.21–2,325.94)
- Bearish trigger: 1h close < 2,148 (<2,105.80–2,062.83)
Drivers
- Top contributors to current view: Return 24h (~0.36%), EMA slope (-0.00043), Funding Z-score (0.512), Basis Z-score (0.447), OB/EMA5 signals (0.158), BTC 24h return (0.012)
- Momentum and volatility: Trend strength moderate at 0.134; volatility regime very low; depth-related indicators show mixed signals (Depth USD 10bp log1p: 16.34)
- Overall: Mixed signals with a slight tilt toward risk-on if ETH can sustain a move above 2,236.
ETF Flows (BTC/ETH)
Note: ETF data here refers to BTC and ETH ETF flows and provides contextual market backdrop rather than a primary signal for ETH price direction. The data indicates net flows that may influence risk sentiment but should not be treated as a standalone ETH forecast.
- BTC ETF: 1D −$142.0M; 5D +$351.1M; 10D +$74.7M
- ETH ETF: 1D −$63.5M; 5D +$10.9M; 10D −$49.3M
Interpretation: The BTC ETF breadth suggests a dynamic risk appetite with mixed short-term net flows, while ETH ETF activity shows modest outflows on the latest day but demonstrates longer-term inflows over a 5-day window. This context can influence correlations and general sentiment, but ETF data should be considered supplementary to ETH-specific TA signals.
What to Watch Next
- Watch for a close above 2,236 to validate the bullish breakout path toward 2,281.21–2,325.94.
- Monitor intra-day moves near 2,148; a break below could accelerate a move toward 2,062–2,105.80.
- Observe changes in volatility regime from very low to higher levels, which could accompany a shift in momentum.
- Keep an eye on BTC ETF flow shifts as a supplementary risk-off/risk-on signal, noting that ETF data is contextual, not a primary ETH signal.
Hashtags: #ETH #Ethereum #CryptoMarkets #TechnicalAnalysis #ETFFlows #BTC #MarketOutlook #PriceAction #TradingStrategy #CryptoNews