Market Snapshot
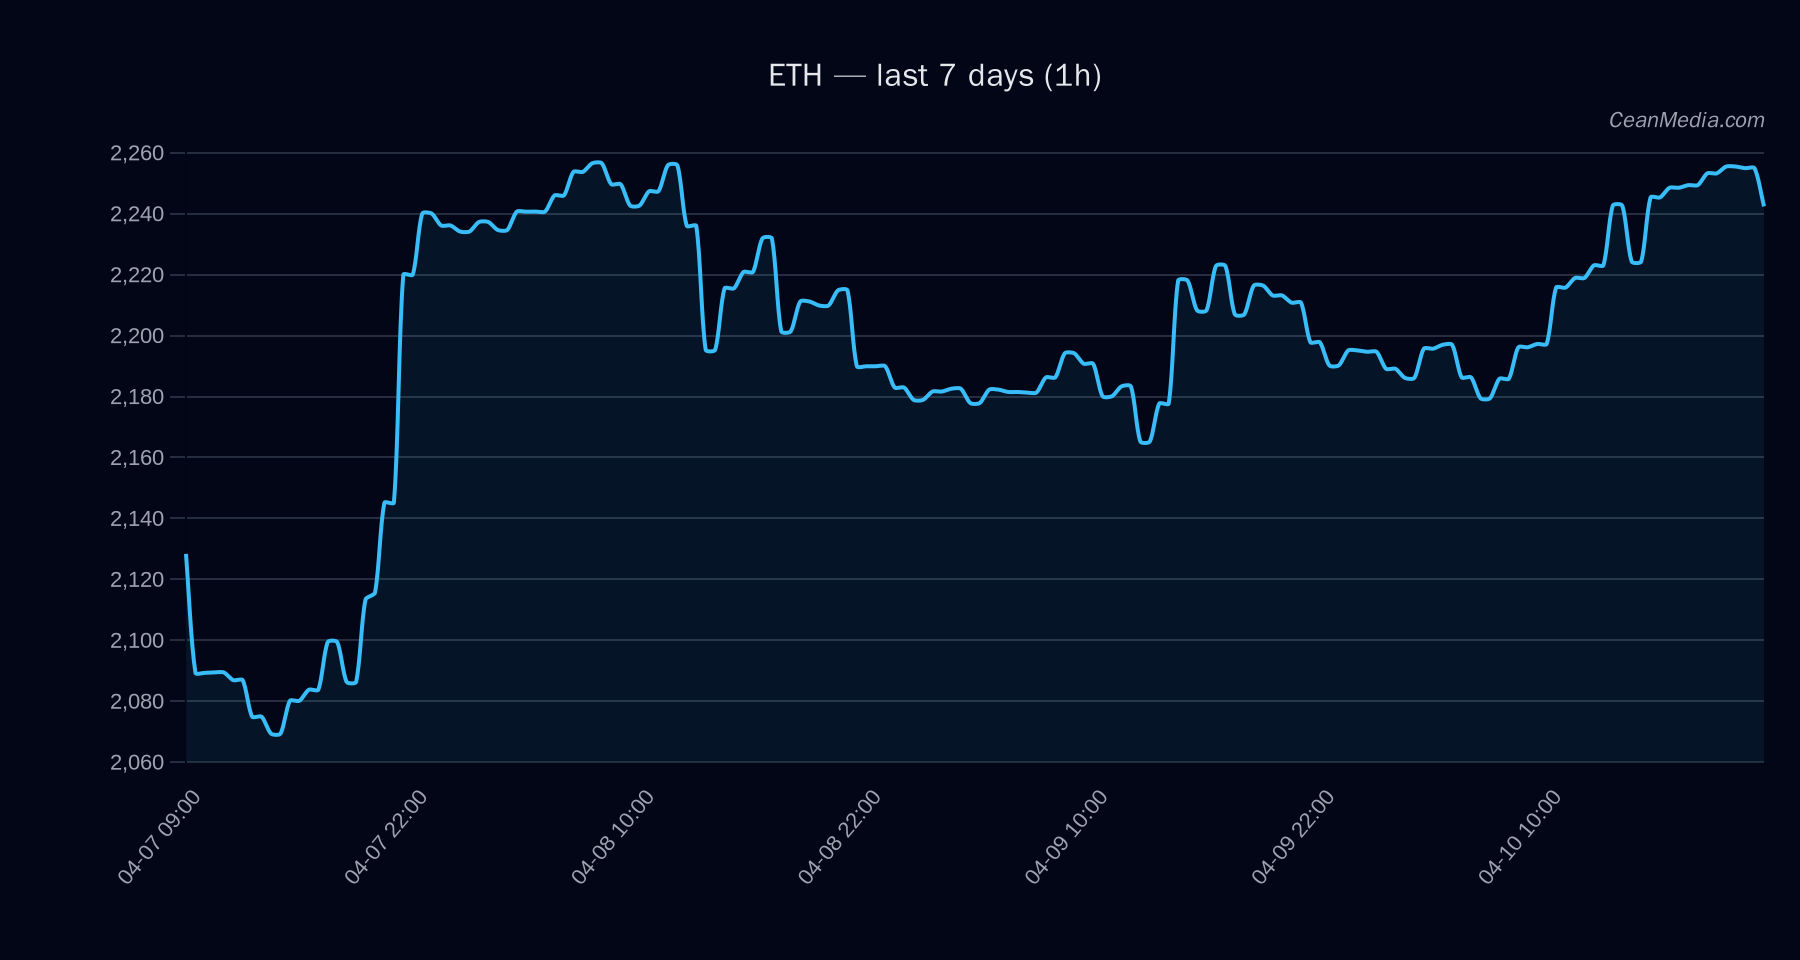
ETH trades near a tight band in the 2,110–2,286 area, with the next actionable move contingent on a breakout above 2,286 or a break below 2,196. The broader context shows very low volatility and mixed near-term momentum indicators, with a bullish bias on short-term TA signals but a sideways forecast over the next 24 hours.
Technical Analysis: ETH
- Current Price: 2,240.66
- Forecast: Sideways (13%)
- Probabilities: Up 45%, Side 13%, Down 42%
- Key Indicators: EMA12>EMA26, SMA50>SMA200, RSI 59, σ24h 0.43%, Vol regime: Very low
- Rationale: The price is confined between major support at 2,110 and major resistance at 2,208, with near-term resistance at 2,286 and near-term support at 2,196.
- Targets: If 1h close > 2,286, potential move to 2,331.18 – 2,376.89. If 1h close < 2,196, potential decline to 2,151.93 – 2,108.01.
- Bias: Short-term bullish-on-breakout scenario; otherwise neutral to sideways with very low volatility.
- Invalidation: Break below 2,196 weakens the bullish setup and targets 2,108–2,151 range; break above 2,286 strengthens upside toward 2,331–2,377.
Drivers
- Top drivers reflect a mix of order-book dynamics, spread metrics, and trend components:
- LIQ TO OI EMA12: strong contribution (0.79) indicating liquidity dynamics ahead of price action
- SPREAD Z-SCORE: negative contribution (-0.46)
- SPREAD BP: negative contribution (-0.37)
- LS GLOBAL Z-SCORE: negative contribution (-0.31)
- TBI EMA10: positive contribution (0.28)
- DRAWDOWN 30D: positive contribution (0.23)
- TBI Z-SCORE: positive contribution (0.23)
- DEPTH USD 10BP LOG1P: positive contribution (0.22)
- BTC Correlation and Market Breadth: 72h BTC correlation 0.92; breadth metrics show broad participation (>50h) at 100%.
- Volatility Regime: Very low, with subdued price movement expectations in the near term.
ETF Flows (BTC/ETH)
ETF flow context is provided for BTC and ETH only and should be interpreted as contextual risk sentiment rather than a primary signal for ETH price action:
- BTC ETF: +$35.5M (1D), +$269.1M (5D), +$172.1M (10D) — indicates net positive flow for BTC over the 1-5-10 day windows, suggesting nominal risk-on or demand for BTC futures exposure.
- ETH ETF: -$8.1M (1D), -$27.2M (5D), -$55.5M (10D) — shows modest outflows, contributing to a cautious backdrop for ETH-specific ETF exposure but not to be construed as a primary ETH signal.
What to Watch Next
- Monitor 1h close relative to 2,286 (near-term resistance) for potential breakout continuation toward 2,331–2,377.
- Watch for a daily close below 2,196 (near-term support) which could invite a test of 2,151–2,108.
- Keep an eye on ETF flow momentum for BTC, as stronger BTC demand can influence risk sentiment and correlate with ETH during risk-on periods.
- Maintain awareness of volatility regime shifts; a move from very low to higher volatility could precede more decisive price action.
Hashtags: #ETH #Ethereum #CryptoMarkets #TechnicalAnalysis #ETFFlows #MarketSentiment #BTC #PriceAction #Liquidity #Volatility #RiskOn #TradingStrategy