Market Snapshot
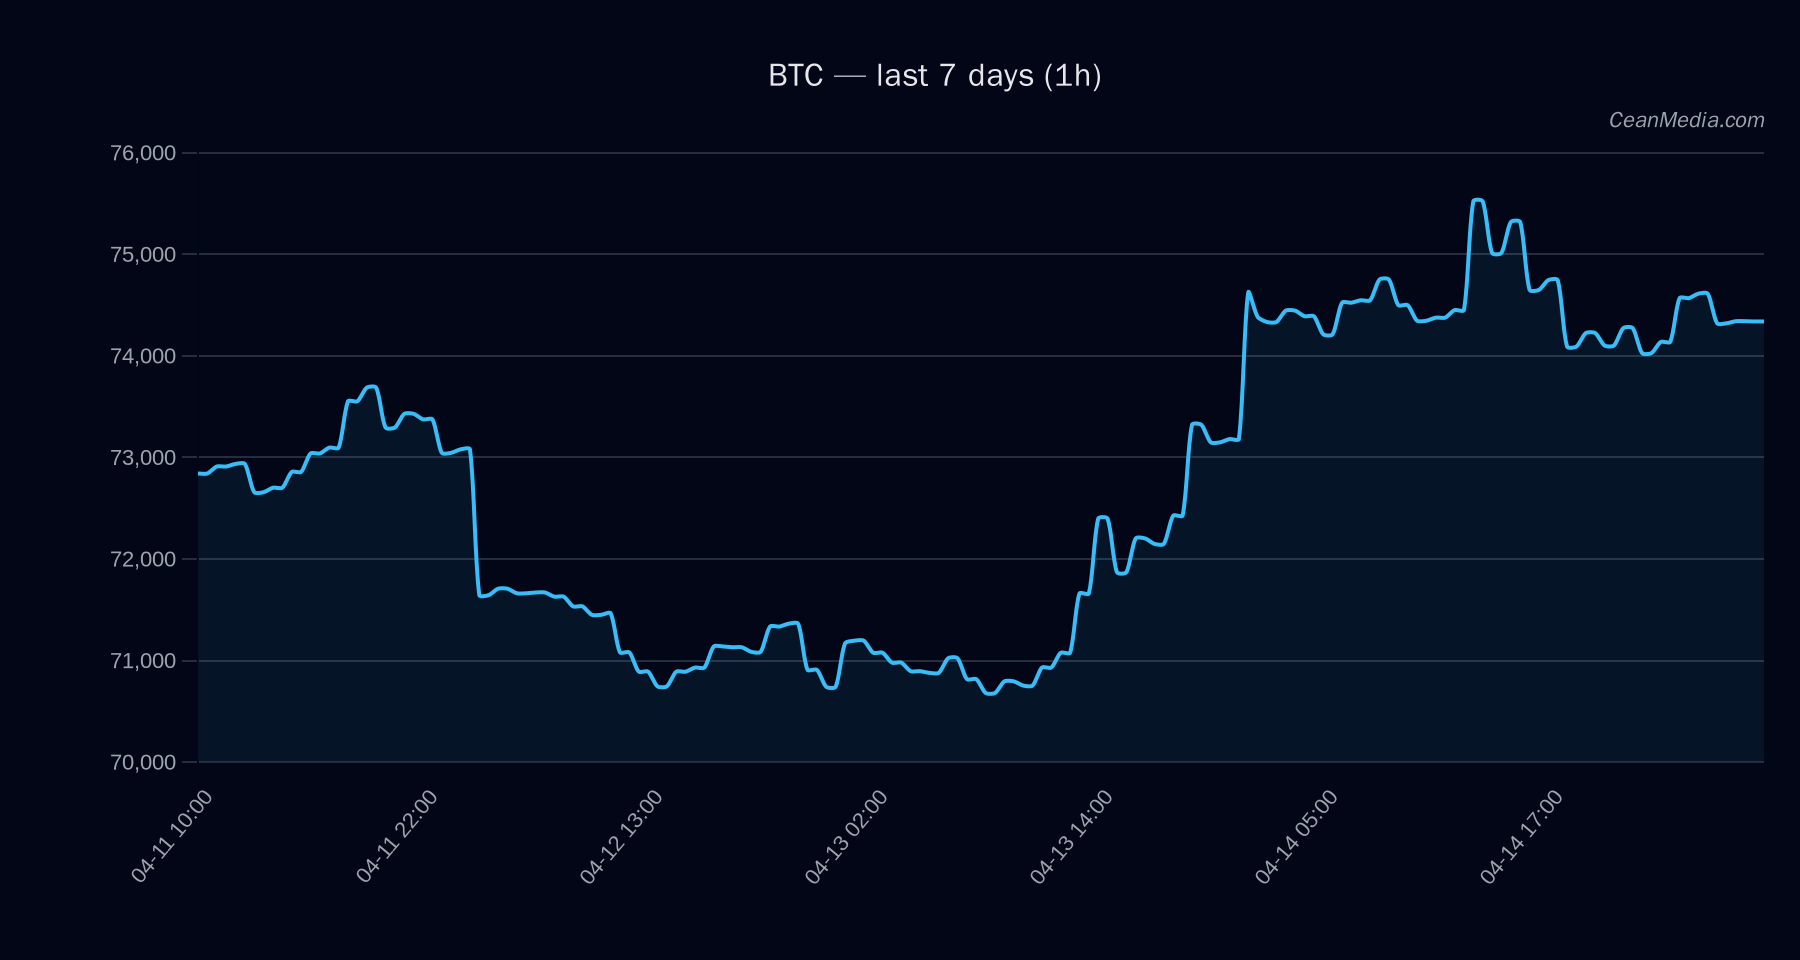
Bitcoin (BTC) trades in a narrow range around the mid-70k area, with the latest price near $73,940. Short-term bias points to a downside probability (~47%) within the immediate horizon, while upside probability stands at ~42%. The market context shows very low volatility regime and subdued breadth, with sentiment aligned to cautious risk-off conditions.
Technical Analysis: BTC
- Current levels: Price ~$73,940; Band (P20–P80): $69,604 – $74,506. Major support at $69,925; nearby support at $72,425. Major resistance at $73,125; nearby resistance at $75,400.
- Bias and momentum: Forecast is down with a 47% probability. Technical indicators show EMA12 > EMA26 and SMA50 > SMA200, RSI at 47, and very low 24h volatility (σ24h ≈ 0.49%).
- Bias confirmation and invalidation: Break above $75,400 would shift the immediate projection toward $76,898–$78,406. Break below $72,425 would target $70,985–$69,536.
- Key ranges: P50 at $73,350; P20–P80 range $69,604–$74,506. The risk band suggests a delicate balance between support and resistance in the near term.
- Top drivers (qualitative): Dominant inputs include liquidity/spread dynamics, order-book imbalances, and funding-related z-scores. Momentum signals remain modest with a distance-from-ma factor supporting a pullback scenario if price fails to clear resistance.
Drivers
- Top factors influencing BTC price: returns over 24h, EMA slope, funding z-score, basis z-score, order-book imbalance (EMA5).
- Key numeric signals: funding z-score heavy negative exposure (~-2.87) suggesting a cost to longs, and a marginal negative BTC 24h return (~-0.07%).
- Market breadth and breadth-related metrics show mixed signals, with volatility regime described as very low and overall trend strength modest (trend strength ≈ 0.03).
ETF Flows (BTC/ETH)
The ETF flow data provided is BTC/ETH specific and should be interpreted as contextual backdrop rather than a primary signal for BTC price action. BTC ETF flows show +$141.1M in 1D inflows, with -$48.8M over 5D and +$506.2M over 10D. ETH ETF data indicates small weekly activity overall. These figures may reflect portfolio reweighting and hedging activity rather than direct price drivers for BTC.
What to Watch Next
- Monitor price behavior around $75,400 for potential breakout or rejection, with a confirmed close above establishing a path toward $76,898–$78,406.
- Observe break below $72,425 for acceleration toward $70,985–$69,536, particularly if downside momentum strengthens.
- Watch changes in funding z-score and order-book imbalance (EMA5) for shifts in short-term sentiment.
- Keep an eye on ETF flow updates and broader market breadth as potential context signals, while maintaining BTC-specific levels as the primary guide.
Hashtags: #Bitcoin #BTCAnalysis #CryptoMarkets #TechnicalAnalysis #ETFFlows #MarketStructure #PriceAction #CryptoNews #TradingStrategy #Volatility #Liquidity #MarketContext
Note: ETF data is provided for BTC/ETH context and is not intended as the primary signal for BTC trading decisions.