Market Snapshot
BNB is trading near the mid-600s with a current price of 594.31 (as of the latest TA). The short-term forecast leaned toward an upside bias at 68% probability, with volatility described as very low. The current technical setup shows mixed signals: EMA12 below EMA26, SMA50 above SMA200, and RSI at 31, indicating neutral to modestly oversold conditions. The immediate range suggests watchful reaction around key support and resistance levels.
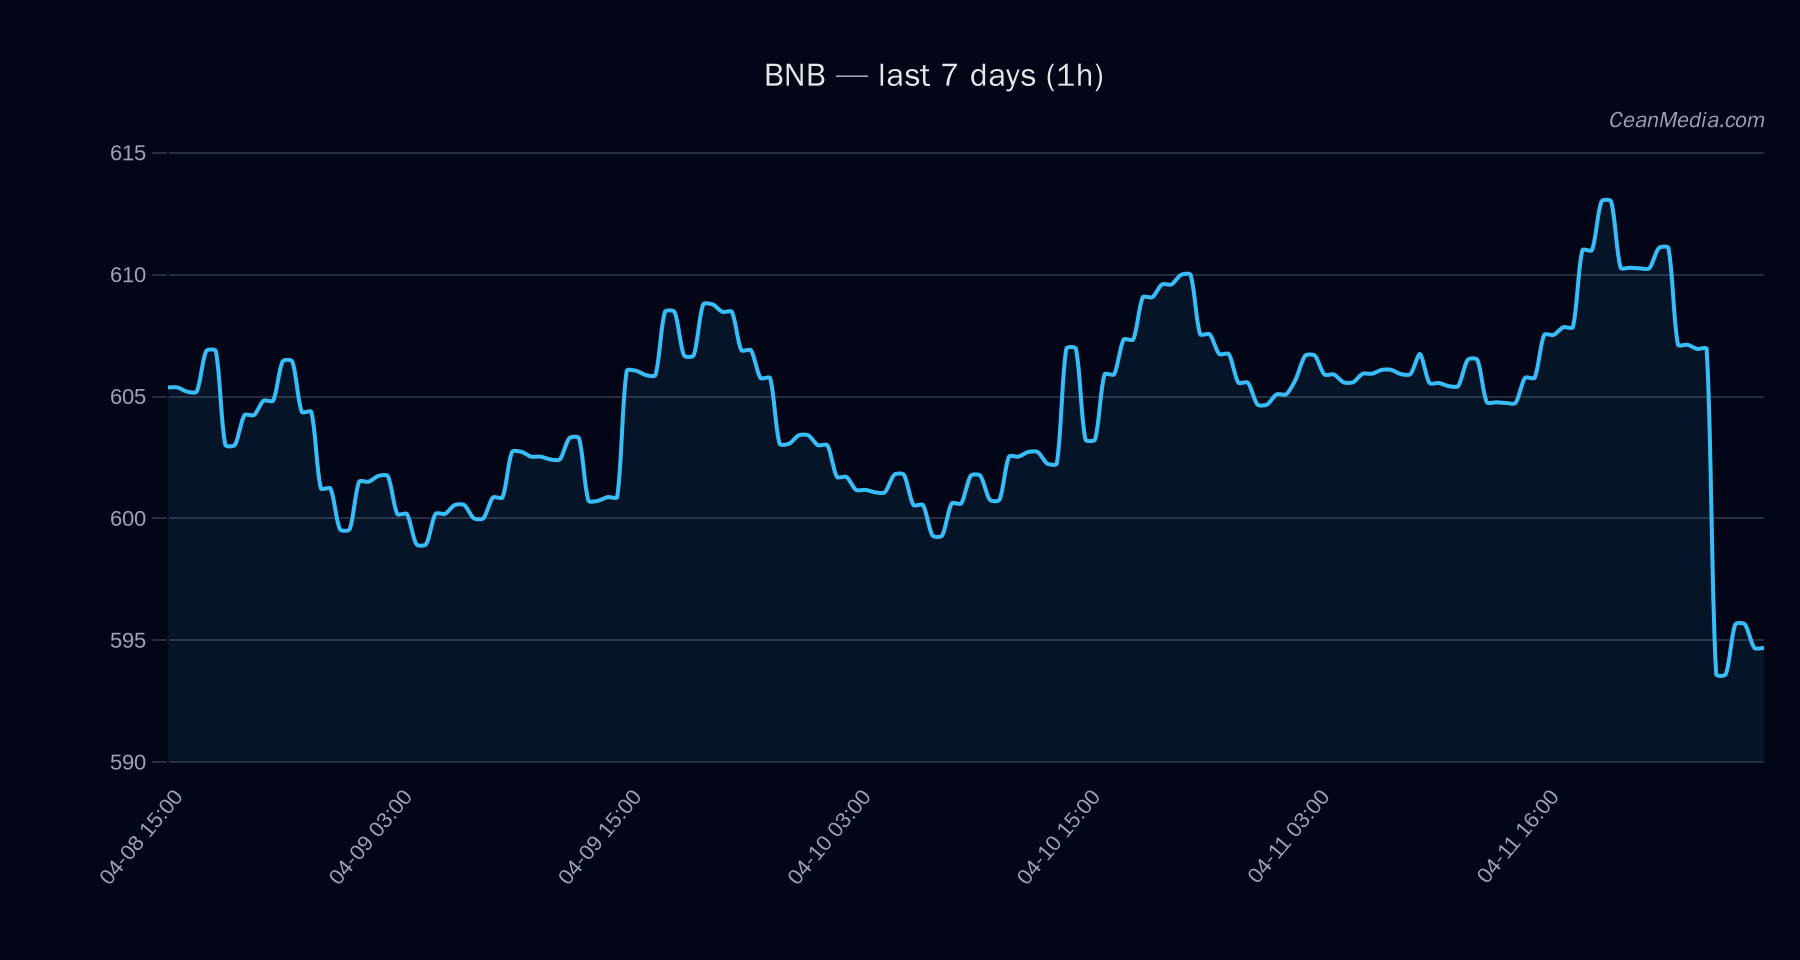
Technical Analysis: BNB
594.31 Break above 606 targets 618.3201–630.444; Break below 582 targets 570.7753–559.1268. EMA12<EMA26; SMA50>SMA200; RSI 31; Volatility regime: Very low 599.35 596.25 – 611.06 A move decisively above 606 with sustained closes would strengthen the upside trajectory; a break and close below 582 would shift risk toward the lower band, targeting 559–571.
Drivers
positive momentum signals around SPF-like spread balance with a negative contribution from LS TOP DELTA 24H; overall reliance on funding and basis metrics as drivers. Vol regime: Very low; RSI remains in oversold territory, which can precede a short-term bounce if buyers step in near support. Funding Z-Score +2.79; Basis Z-Score -1.25; RV 7D +0.02; Breakout 7D -0.04; Spread BP +0.93.
ETF Flows (BTC/ETH)
Contextual market signal: ETF flows are provided for BTC and ETH and are not a primary signal for BNB. The BTC ETF shows +$231.3M in 1D, +$587.6M in 5D, and +$324.9M in 10D; ETH ETF shows +$76.4M (1D), +$40.3M (5D), and -$2.9M (10D). These figures reflect broader institutional demand in the leading crypto pairings and may influence market risk sentiment and correlations but do not directly determine BNB price moves.
Interpretation: The presence of positive ETF flows in BTC/ETH can signal risk-on appetite and liquidity support across crypto markets. However, given BNB’s own technical setup and asset-specific drivers, traders should treat ETF data as contextual rather than a primary driver for BNB positioning.
What to Watch Next
- Watch for a daily close above 606 to confirm potential Upside continuation toward 618–630.
- A break and close below 582 would shift the bias toward the lower target range (570–559).
- Monitor RSI and volume for any divergence as the price tests key levels (606 and 618).
- Consider BTC/ETH ETF flow momentum as a broader market context but maintain primary focus on BNB-specific levels and drivers.
Hashtags: #BNB #CryptoAnalysis #TechnicalAnalysis #BTCETFFlows #ETHETFFlows #MarketSnapshot #TradingStrategy #Altcoin #CryptoTrading #PriceAction #SupportResistance #Volatility
Note: ETF data provided here covers BTC and ETH and is intended as contextual market backdrop. It should not be used as the sole driver for BNB trading decisions.