Market Snapshot
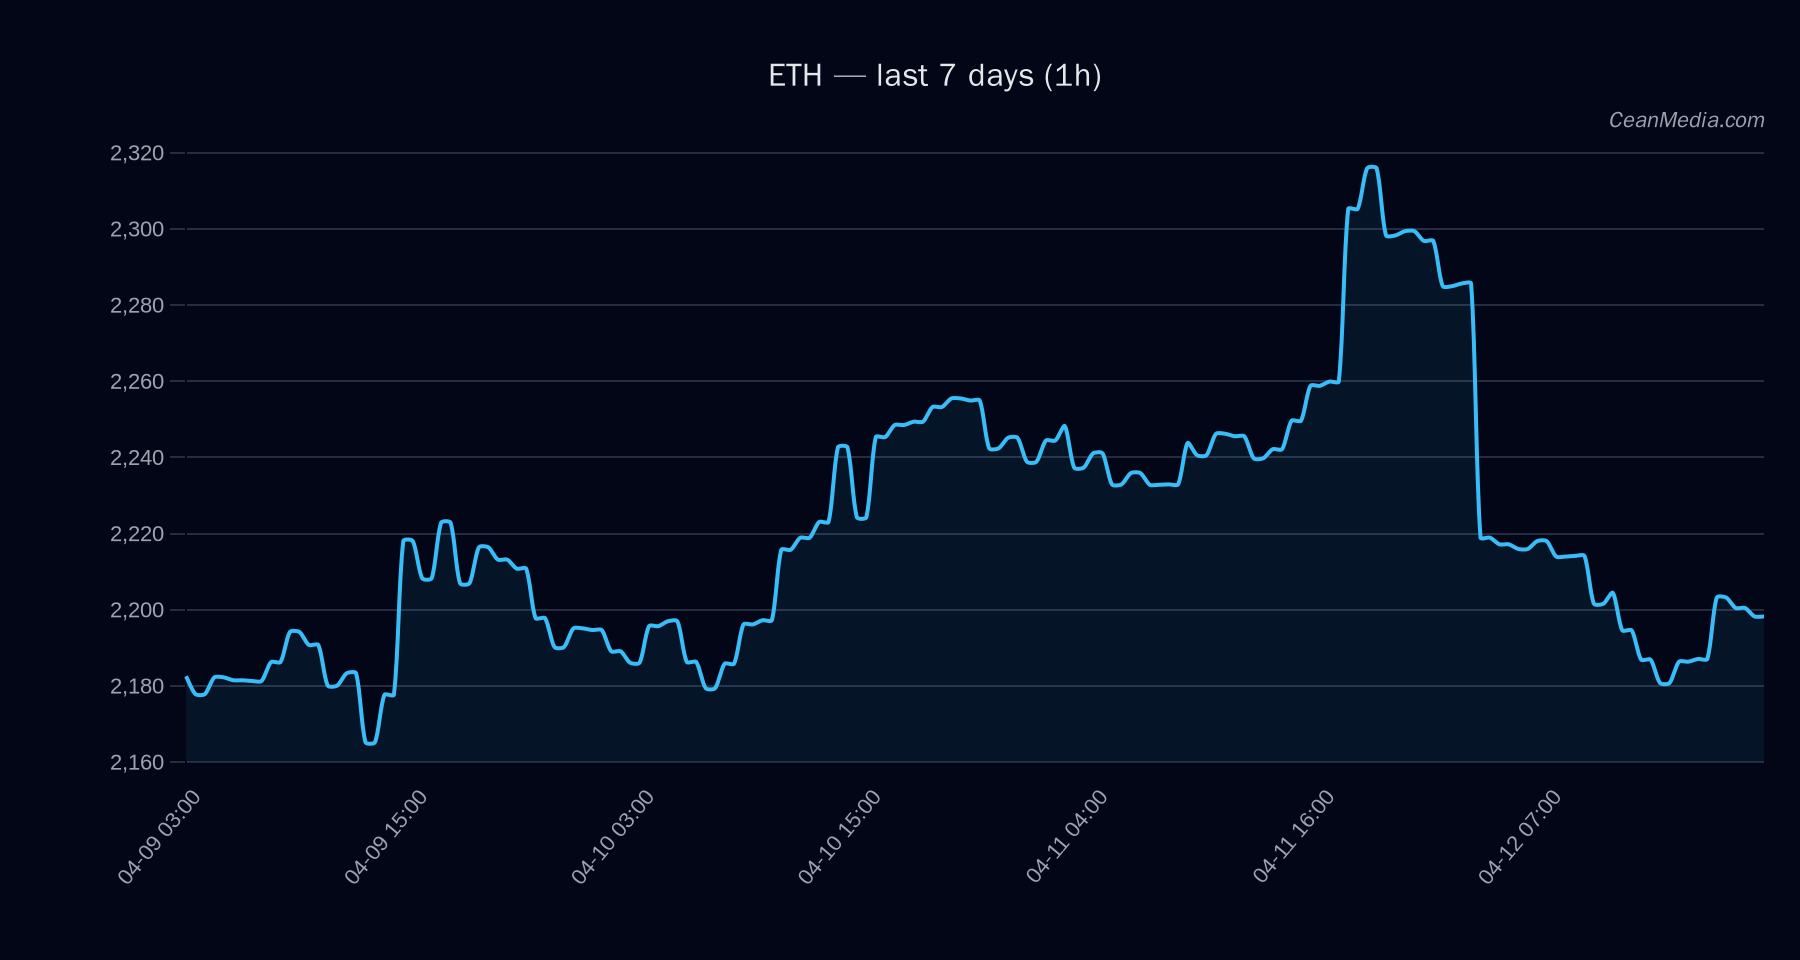
ETH trading around the mid-2.2K area with a current price near 2,206.78. The short-term forecast tilts toward upside at 47% probability, but the near-term bias remains mixed given the price structure, volatility regime is very low, and RSI sits at 44. Major support sits at 2,100 with near-term 2,162 as a fallback; resistance is near 2,238 with a closer target around 2,250. ETF flow context provided for BTC/ETH is supportive of risk-on sentiment but should be viewed as ancillary data rather than a primary ETH signal.
Technical Analysis: ETH
- Current levels: Price 2,206.78; Support 2,162 (near) / 2,100 (major); Resistance 2,250 (near) / 2,238 (major).
- Forecast and bias: Forecast: up (47%); TA indicates sideways mechanics with EMA12
- Key triggers: Break above 2,250 targets 2,295.93–2,340.95; Break below 2,162 targets 2,119.39–2,076.14.
- Indicators snapshot: RSI neutral at 44; EMA12
- Probability distribution (P20–P80): 2,118.02 – 2,372.29; P50 (mid) 2,226.72.
Drivers
- Top drivers and contributions show mixed signals, with SPREAD Z-SCORE contributing positively (0.85) but FUNDING Z-SCORE presenting a negative pressure (-1.31).
- Order-book imbalance (EMA5) is modestly positive (0.54) as a near-term momentum cue.
- Overall trend factors (trend_strength, distance_from_ma) indicate modestly negative distance from MA and a slight tilt in trend strength toward consolidation rather than a clear breakout.
- BTC-related factors: BTC 24h return around -3.5% and BTC trend metrics suggest correlated risk-on/off dynamics, but ETH-specific signals remain the primary driver here.
ETF Flows (BTC/ETH)
ETF flow context is included as a market context feature and is limited to BTC and ETH ETFs in this dataset. BTC ETFs show stronger inflows in 1D (+$231.3M) and multi-day windows, while ETH ETFs exhibit smaller but positive 1D inflows (+$76.4M). 5D and 10D flows show broader divergence. It is important to note that ETF data is contextual and not a primary signal for ETH pricing.
- BTC ETF: 1D +$231.3M | 5D +$587.6M | 10D +$324.9M
- ETH ETF: 1D +$76.4M | 5D +$40.3M | 10D -$2.9M
What to Watch Next
- Monitor a close above 2,250 for potential extension toward 2,295–2,341 in the near term.
- Watch for a break below 2,162 to assess downside risk toward 2,119–2,076.
- Observe volume and volatility cues given very low volatility regime; any spike could precede a regime shift.
- Keep ETF flow context in mind as a supplementary risk-on/off signal but not a primary ETH directional driver.
Hashtags: #ETHAnalysis #CryptoMarkets #ETHTechnical #ETFFlows #BTCETF #AltMarkets #MarketSnapshot #PriceAction #RiskManagement #TradingStrategy #CryptoNews #MarketSignals