Market Snapshot
On 2026-04-14, XRP trades near 1.37 USD with a near-term bias to the upside. Key context includes a very low volatility regime, a backdrop of broad market breadth signals, and BTC/ETH ETF flows that suggest modest risk-on/-off sentiment within crypto markets. ETF data presented here covers BTC and ETH and should be considered context rather than a primary XRP signal.
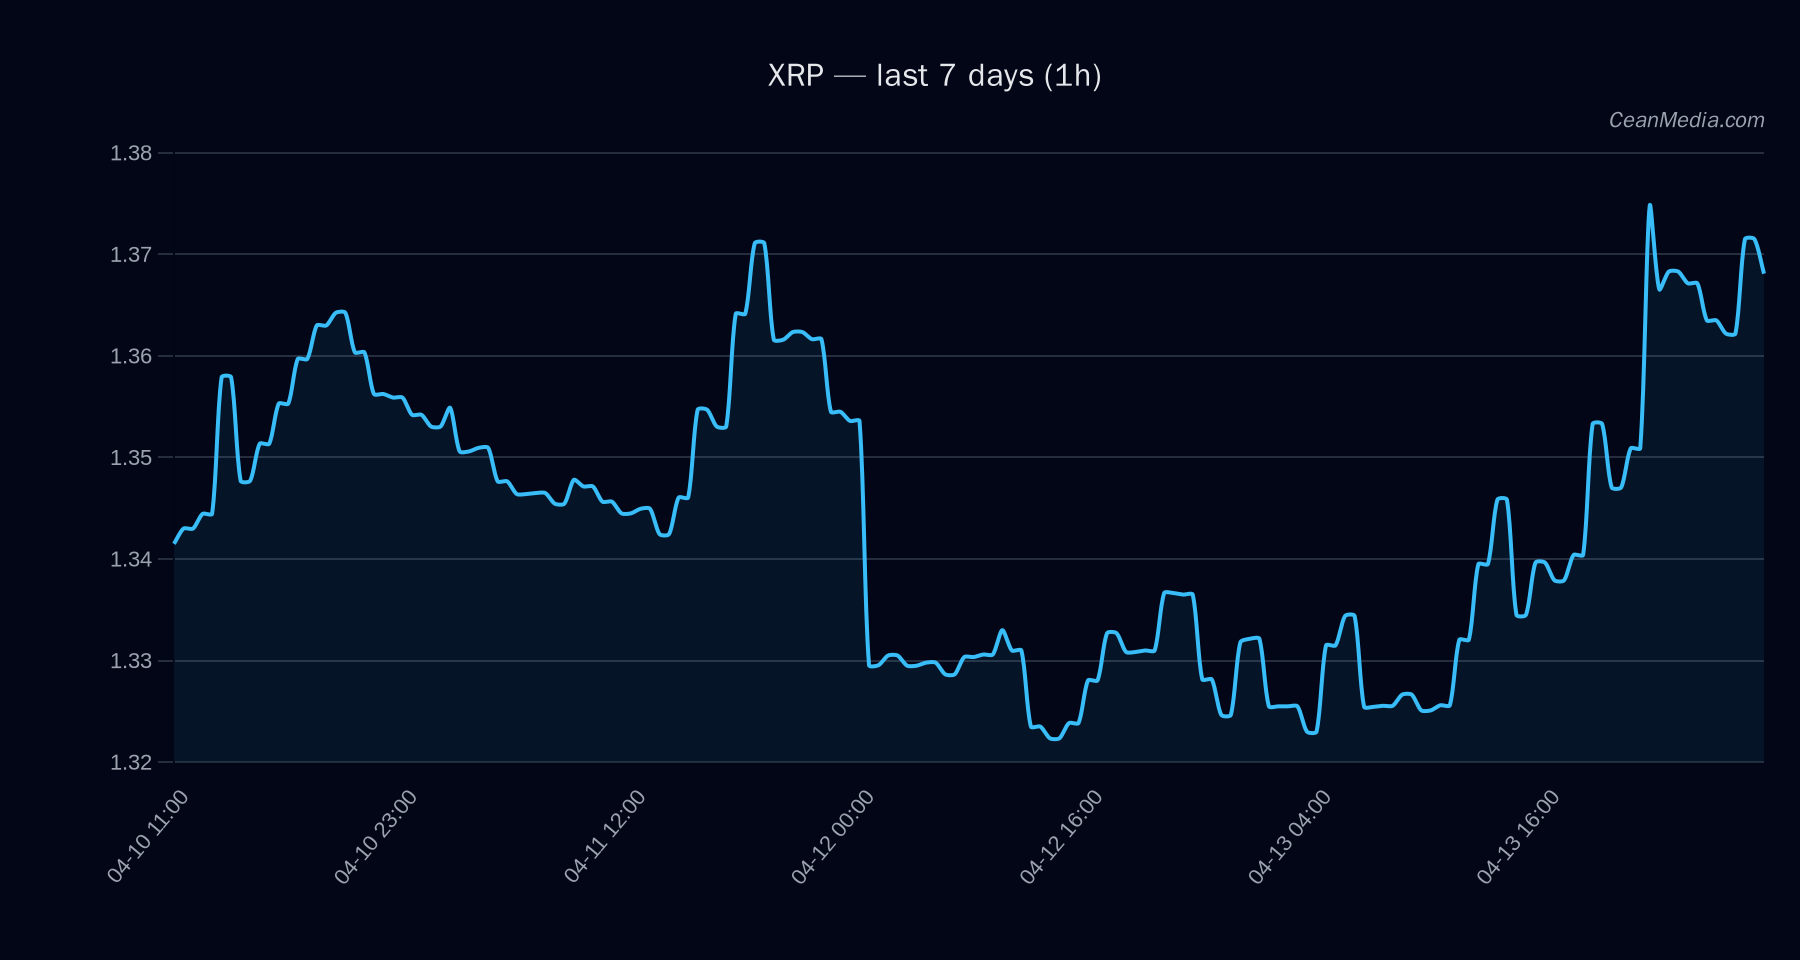
Technical Analysis: XRP
- Current price: 1.3684
- Short-Term Forecast: Up (49%)
- Key indicators: EMA12 > EMA26, SMA50 < SMA200, RSI 63, σ24h 0.55%
- Price bands: P20–P80 = 1.335 – 1.3899; Band midpoint ~1.362
- Support / Resistance: Major Support 1.32; Near Support 1.34; Major Resistance 1.36; Near Resistance 1.40
- Upside trigger: 1h close > 1.40 → 1.4237 – 1.4516
- Downside trigger: 1h close < 1.34 → 1.3142 – 1.2874
- Momentum context: RSI neutral to mildly bullish; Vol regime: Very low
- Trend context: EMA12>EMA26; SMA50
- Forecast summary: Up; TA indicates sideways bias within a tight range; key levels define what constitutes a breakout or breakdown.
Drivers
- Top models drivers indicate mixed contributions with a tilt toward fundamental/flows signals rather than extreme momentum. Notable indicators include:
- LIQ IMB Z-SCORE: contrib -3.32 | value 2.94
- OI DELTA 24H: contrib -1.35 | value 10.19
- SPREAD BP: contrib 1.14 | value 16.14
- LS TOP DELTA 24H: contrib 1.1 | value -5.53
- LS GLOBAL DELTA 24H: contrib -0.93 | value -10.07
- RV 7D: contrib 0.83 | value -0.97
- LS GLOBAL Z-SCORE: contrib -0.64 | value -2.79
- TBI Z-SCORE: contrib 0.61 | value -1.11
- Contextual momentum/readings show breadth on the bullish side (>50h breadth at 100%), BTC/crypto correlation (ρ with BTC over 72h around 0.90), and a low volatility regime that can favor continuation within a tight range unless a breakout occurs.
ETF Flows (BTC/ETH)
The ETF flow data provided focuses on BTC and ETH and should be interpreted as contextual risk appetite signals rather than direct XRP catalysts. The figures show net flows that can influence risk sentiment in crypto markets.
- BTC ETF: 1D -$314.7M | 5D +$263.9M | 10D +$139.6M
- ETH ETF: 1D +$2.6M | 5D +$113.2M | 10D +$38.6M
What to Watch Next
- Watch for a close above 1.40 to validate the upside breakout scenario toward 1.4237–1.4516.
- Monitor for a break below 1.34 to validate a downside scenario toward 1.3142–1.2874.
- Keep an eye on BTC/ETH ETF flow shifts as potential risk-on/off signals in the broader crypto space, noting these are contextual rather than XRP-specific triggers.
- If volatility remains very low, a durable move may require a clear trigger; otherwise expect continued range-bound behavior near current levels.
Hashtags: #XRP #CryptoAnalysis #MarketSnapshot #TechnicalAnalysis #ETFFlows #BTC #ETH #RegimeAnalysis #Liquidity #PriceAction
Note: ETF data is provided for context and reflects BTC/ETH flows, not XRP-specific signals.