Market Snapshot
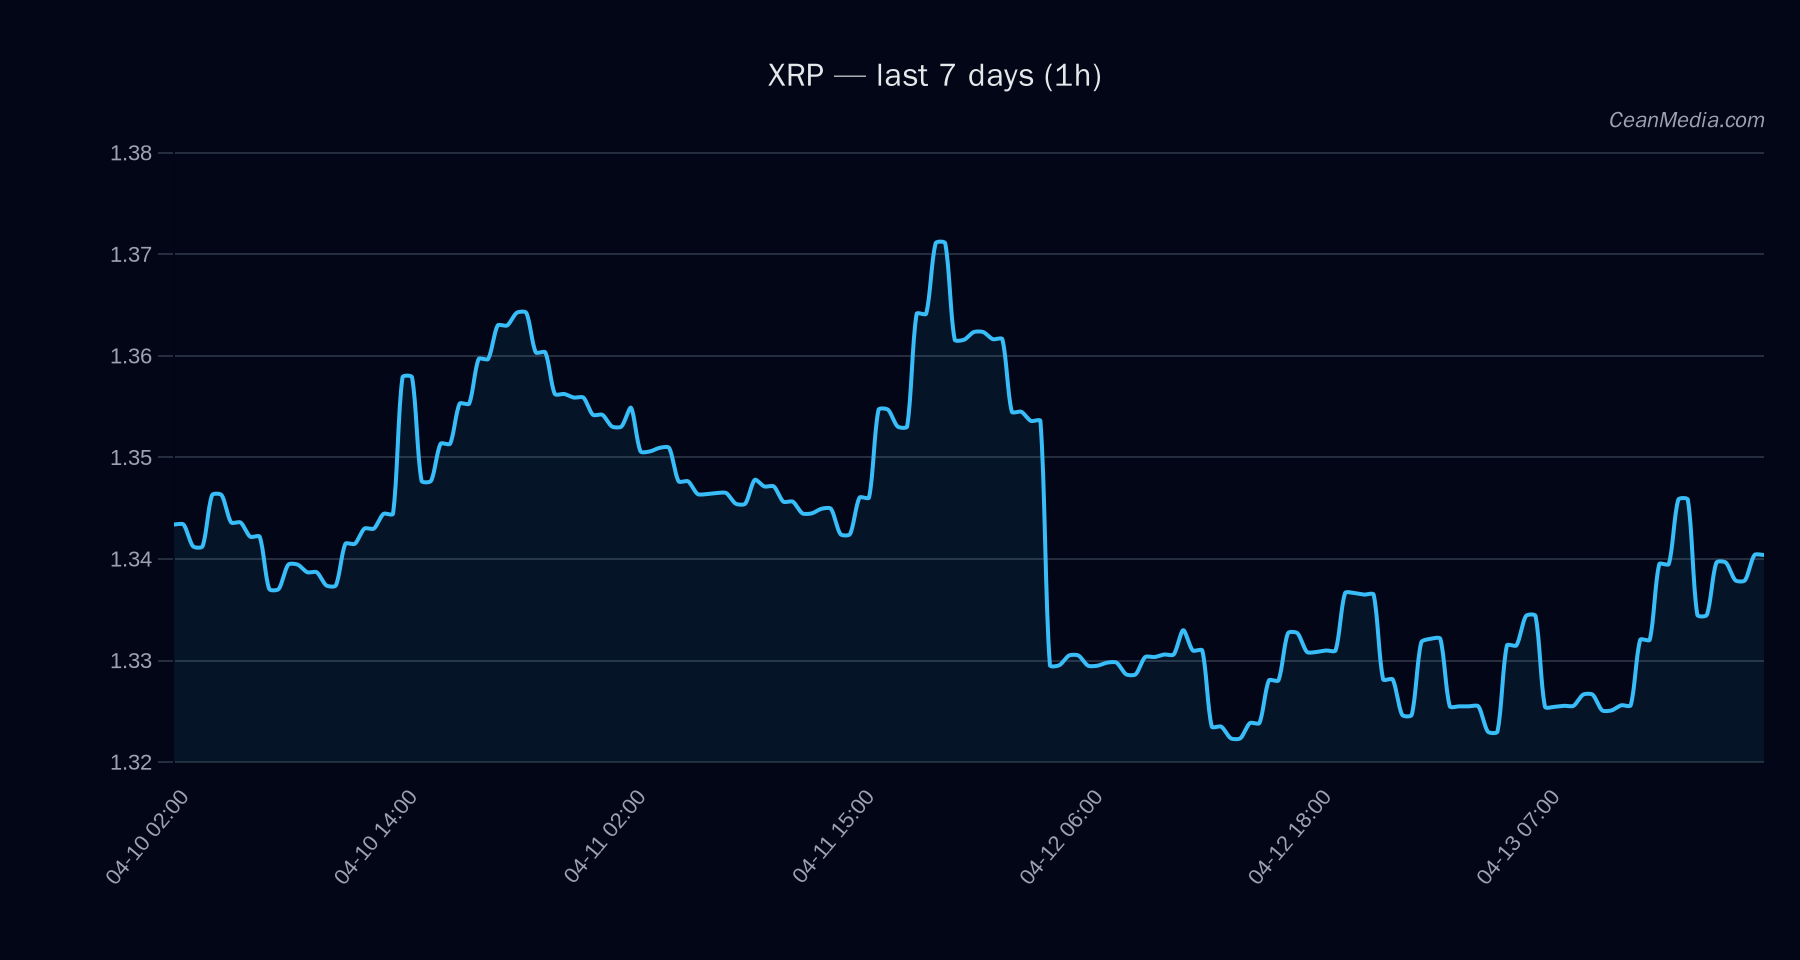
As of 2026-04-13, XRP trades near key support and resistance levels, with the near-term bias leaning to the downside (52% probability) according to the latest model. The instrument sits between notable pivots at 1.32 (support) and 1.38 (resistance), with the near-term range approximately 1.308–1.391. Overall market tone shows very low volatility regime and elevated but not extreme fear indicators in broader market sentiment, while BTC correlated strength remains supportive of a risk-off to neutral stance for XRP in the near term.
Technical Analysis: XRP
- Price and Bias: Price 1.3545; Short-Term Forecast: down (51%); Up 33%, Side 15%, Down 51%.
- Key Indicators: EMA12 > EMA26; SMA50 < SMA200; RSI 65; 24h volatility 0.47% (Very Low); Volatility regime: Very low.
- Support & Resistance: Major support 1.32; Near support 1.32; Major resistance 1.36; Near resistance 1.38.
- Break Scenarios: Break above 1.38 targets 1.4092–1.4369. Break below 1.32 targets 1.3009–1.2743.
- Band & Range: P20–P80: 1.3081–1.3911. P50 (mid): 1.3436.
- Forecast: Down (51%); RSI currently neutral with a mixed momentum signal. The immediate term remains within a sideways-leaning framework.
- Invalidation/Triggers: Invalidation not explicitly stated; primary trigger levels are 1.38 (upside breakout) and 1.32 (downside breakout).
Drivers
- Top drivers include spread BP, global delta metrics, order-book dynamics, and realized BTC movement. Net contributions indicate modest negative pressure from global delta and spread considerations, with some supportive input from order-book imbalance and BTC-related signals.
- Contextual momentum: Breadth remains positive (>50%), BTC/BTC.D relationship is supportive, and the overall volatility regime remains very low, suggesting a cautious, range-bound environment for XRP in the near term.
- Key numerical drivers (from the top model):
- Return 24h: small positive move
- EMA slope: marginally bullish tilt
- Funding Z-score: modestly elevated risk appetite
- Basis Z-score: elevated negative pressure signal
- BTC return (24h): positive influence
ETF Flows (BTC/ETH)
The ETF flow context provided is limited to BTC and ETH: BTC ETF shows positive inflows across 1D, 5D, and 10D horizons (1D: +$231.3M; 5D: +$587.6M; 10D: +$324.9M); ETH ETF also reports inflows (1D: +$76.4M; 5D: +$40.3M; 10D: -$2.9M). This data reflects activity in BTC/ETH ETFs and is presented as contextual market information rather than a primary signal for XRP. Traders should consider ETF flows as a sentiment and liquidity backdrop that may influence cross-asset correlations and risk appetite, but not as a direct XRP technical indicator.
What to Watch Next
- Watch for a close above 1.38 to signal a potential extension toward 1.4092–1.4369.
- Monitor a daily close below 1.32 to validate downside projections toward 1.3009–1.2743.
- Observe changes in volatility regime and RSI dynamics for potential shifts in momentum from sideways to directional.
- Keep an eye on BTC/ETH ETF flow trends as contextual risk sentiment, particularly for correlated move opportunities in broader crypto markets.
Hashtags: Hashtags in this article are provided below for social sharing and indexing.