Market Snapshot
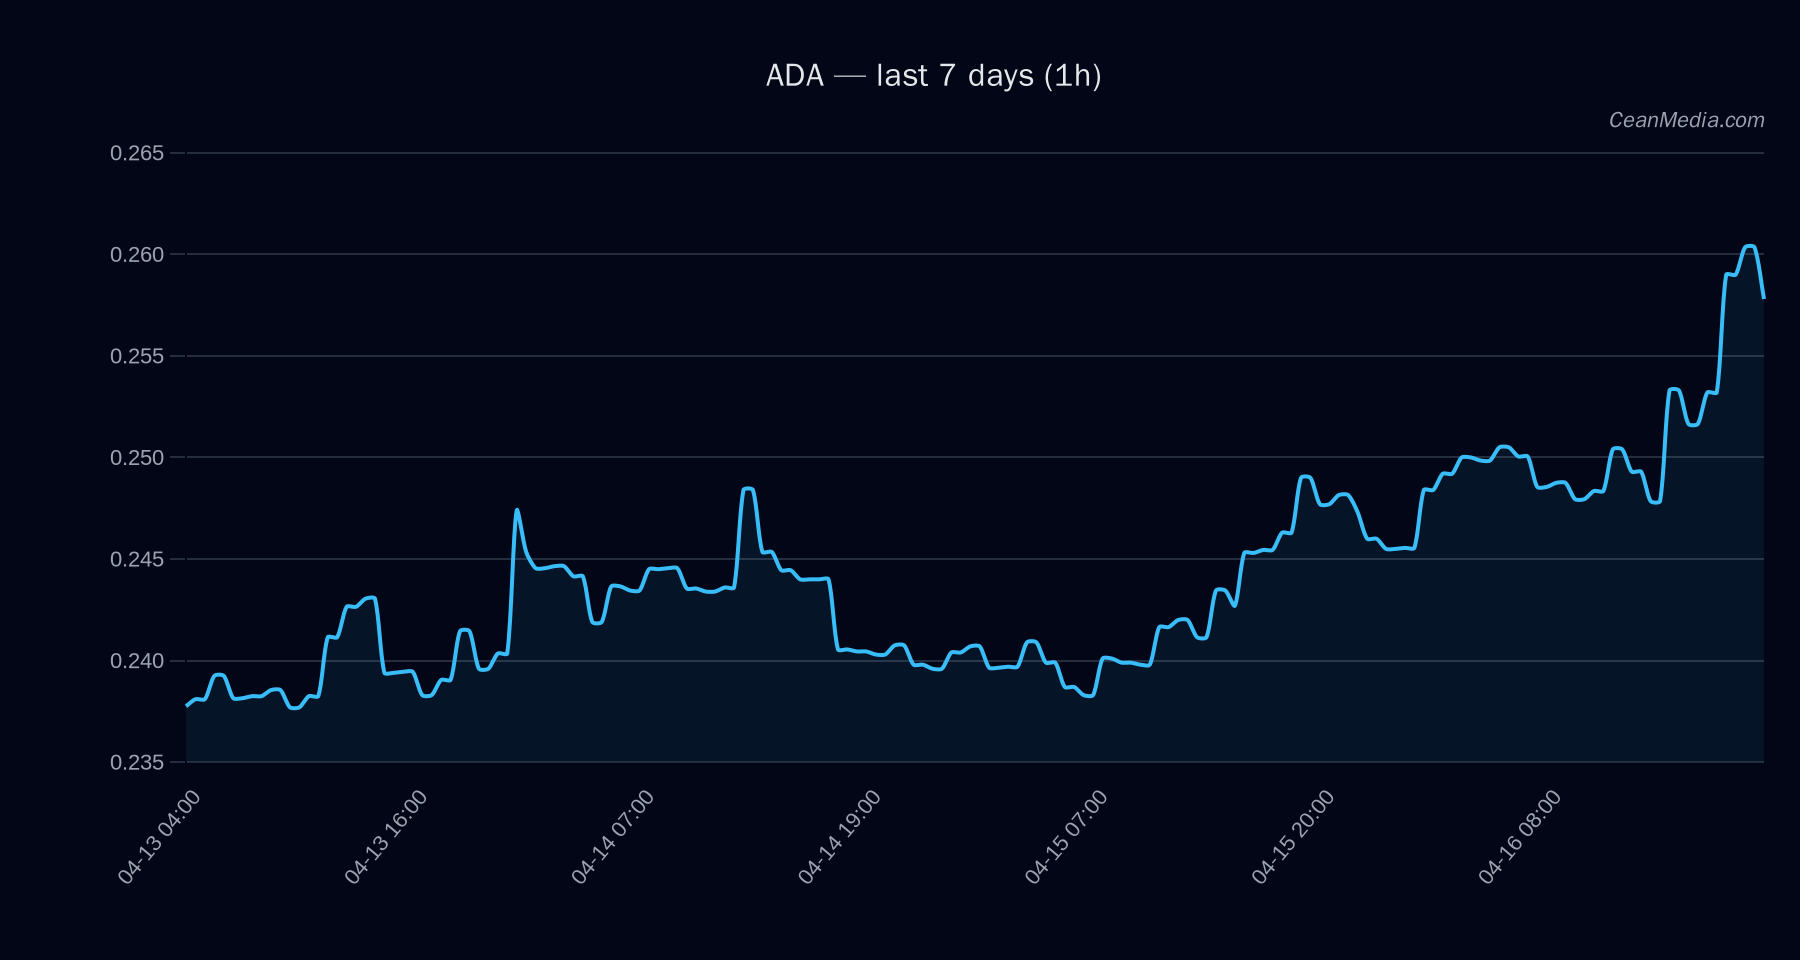
Cardano (ADA) is hovering around key support and resistance near 0.255 and 0.265 respectively. The short-term forecast indicates a down bias (73% probability) with a sideways overarching TA backdrop as of 2026-04-16. Market breadth and related indicators show very low and quiet volume conditions, with a notable RSI reading around 68 but not yet signaling an immediate overbought condition within the near term.
Technical Analysis: ADA
0.255 (support) to 0.265 (resistance) Major Support 0.24; Near Support 0.255; Near Resistance 0.265; Major Resistance 0.255 (note: here 0.255 as resistance is listed in the source as near term) - Upside trigger: 1-hour close > 0.265 would target 0.2687 to 0.274
- Downside trigger: 1-hour close < 0.255 would target 0.2481 to 0.243
EMA12 vs EMA26 (bullish/negative slope), RSI at 68, very low vol (σ24h 0.79%), breadth measures indicating momentum softness. The price action sits between the defined support and resistance with a downside drift favored in the near term unless a breakout occurs above 0.265.
Drivers
- Top drivers (sampled from the model):
- Return 24H: +0.04
- EMA slope: +0.003
- Funding Z-score: +0.605
- BASIS Z-score: +0.661
- Order-book imbalance (EMA5): +0.031
- BTC 24h return: +0.005
- Other noted signals: liquidity-implied metrics and spread metrics show mixed momentum with a tilt toward downside continuation unless a liquidity-driven reversal occurs.
- Volatility: Very low regime; vol-of-vol remains small, suggesting limited near-term breakout risk absent new catalysts.
ETF Flows (BTC/ETH)
The ETF flow data presented is limited to BTC and ETH and should be interpreted as context rather than a primary signal for ADA. Current readings show:
- BTC ETF: 1D outflow of -$105.8M, but 5D inflow of +$252.8M and 10D inflow of +$603.9M
- ETH ETF: 1D inflow of +$7.1M, 5D inflow of +$129.1M, 10D inflow of +$140.0M
Interpretation: Net flow dynamics suggest episodic risk-on/off shifts in BTC/ETH markets, which can influence USD value correlations and risk appetite. This data is not ADA-specific but provides macro context for overall market mood. A sustained BTC/ETH flow shift could indirectly impact ADA via correlated cycles, but ADA remains primarily driven by its own liquidity and on-chain signals.
What to Watch Next
- Monitor a close above 0.265 on increasing volume to validate a potential move toward 0.2687–0.274.
- Watch for a break below 0.255 with volume for a potential move toward 0.2481–0.243.
- Observe changes in volatility regime; any expansion could precede a clearer directional shift.
- Keep an eye on BTC/ETH ETF flow momentum as a macro backdrop for risk-on/risk-off sentiment.
Hashtags: #ADAAnalysis #CryptoTA #CryptoMarkets #ETFFlows #BTC #ETH #MarketSnapshot #TechnicalAnalysis #Liquidity #PriceAction