Market Snapshot
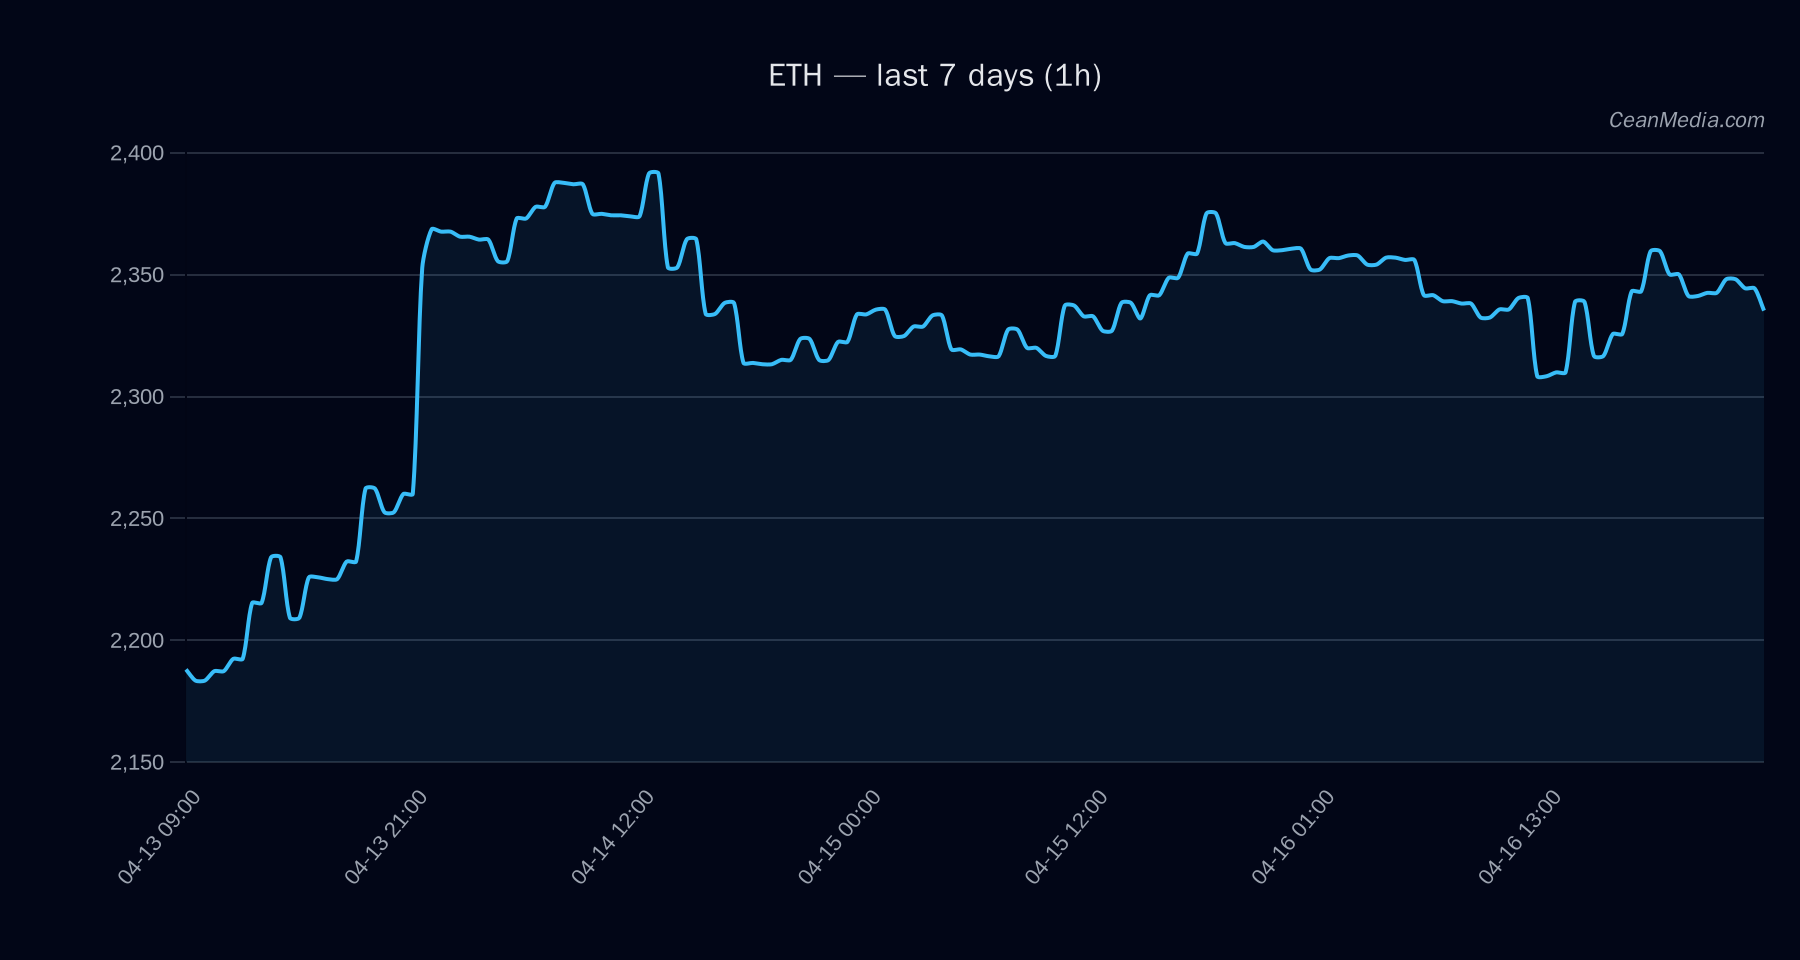
ETH trades around the mid-2,300s with a short-term bias tilted toward the upside. The current price stands at roughly 2,329.09, with key near-term support at 2,282 and resistance at 2,340 (major). A break above 2,376 would activate an upside pathway toward the 2,423.19–2,470.70 zone, while a break below 2,282 would target 2,236.86–2,191.21.
- Band (P20–P80): 2,371.44 – 2,686.74
- Forecast: Up (53%); RSI 46 (neutral)
- Vol regime: Very low
Market breadth is positive (>50h at 83%), and correlations show BTC at 0.90 over 72 hours. ETF flows for BTC/ETH provide context but are not the primary signal for ETH direction today.
Technical Analysis: ETH
- Current price: 2,329.09
- Short-term forecast: Up (53%) with a sideways technical backdrop (EMA12 < EMA26, SMA50 > SMA200)
- Support: Major 2,140; Near-term 2,282
- Resistance: Major 2,340; Near 2,376
- Upside trigger: 1h close > 2,376 targets 2,423.19 – 2,470.70
- Downside trigger: 1h close < 2,282 targets 2,236.86 – 2,191.21
- RSI: 46 (neutral); volatility: σ24h 0.54% with very low volume regime
- Key model drivers: TBI Z-SCORE (0.71), OI Delta (−4.54), LS Global Delta (1.3), Basis Z-Score (−49.65) weighing on momentum, while BTC-related signals provide contextual input.
Invalidation/alternate scenarios: A sustained close below 2,282 would shift bias toward downside targets near 2,191–2,236, whereas a clear move above 2,376 would open the higher band toward 2,423–2,471.
Drivers
- Top drivers by contribution: TBI Z-SCORE (0.71), OI Delta 24h (−4.54), LS Global Delta 24h (1.3), EMA10 slope (−0.0004), Spread Z-Score (−9.8), Basis Z-Score (−49.65).
- Momentum/volatility: Vol regime is very low; RSI is neutral; breadth remains strong (>50h at 83%).
- BTC/ETH context: 72h BTC correlation is high (0.90); ETH ETF 5D flow shows positive inflows (+$129.1M over 5 days) despite BTC ETF outflows on 1D (-$105.8M).
ETF Flows (BTC/ETH)
Contextual signal: ETF flow data for BTC and ETH is provided to frame sentiment but is not a primary driver for ETH price action. BTC ETF activity shows a mixed setup (1D outflow of −$105.8M, 5D inflow of +$252.8M, 10D inflow of +$603.9M). ETH ETF flows are modestly positive (1D +$7.1M, 5D +$129.1M, 10D +$140.0M). The data suggests cautious risk-on sentiment for broader crypto markets but should be weighed against direct ETH technicals and spot drivers.
What to Watch Next
- Climb above 2,376 to validate the upside pathway toward 2,423–2,471.
- Break below 2,282 to explore an initial move toward 2,191–2,236.
- Monitor BTC price action and the BTC/ETH correlation, as high correlation can reinforce ETH’s directional bias in this regime.
- Track ETF flow trends as context; note that BTC/ETH ETF data is not a primary ETH signal but may influence risk sentiment.
Hashtags: #ETH #ethereum #cryptomarket #tradingview #technicalanalysis #etfflows #btc #riskon #riskoff #volume #volatility