Market Snapshot
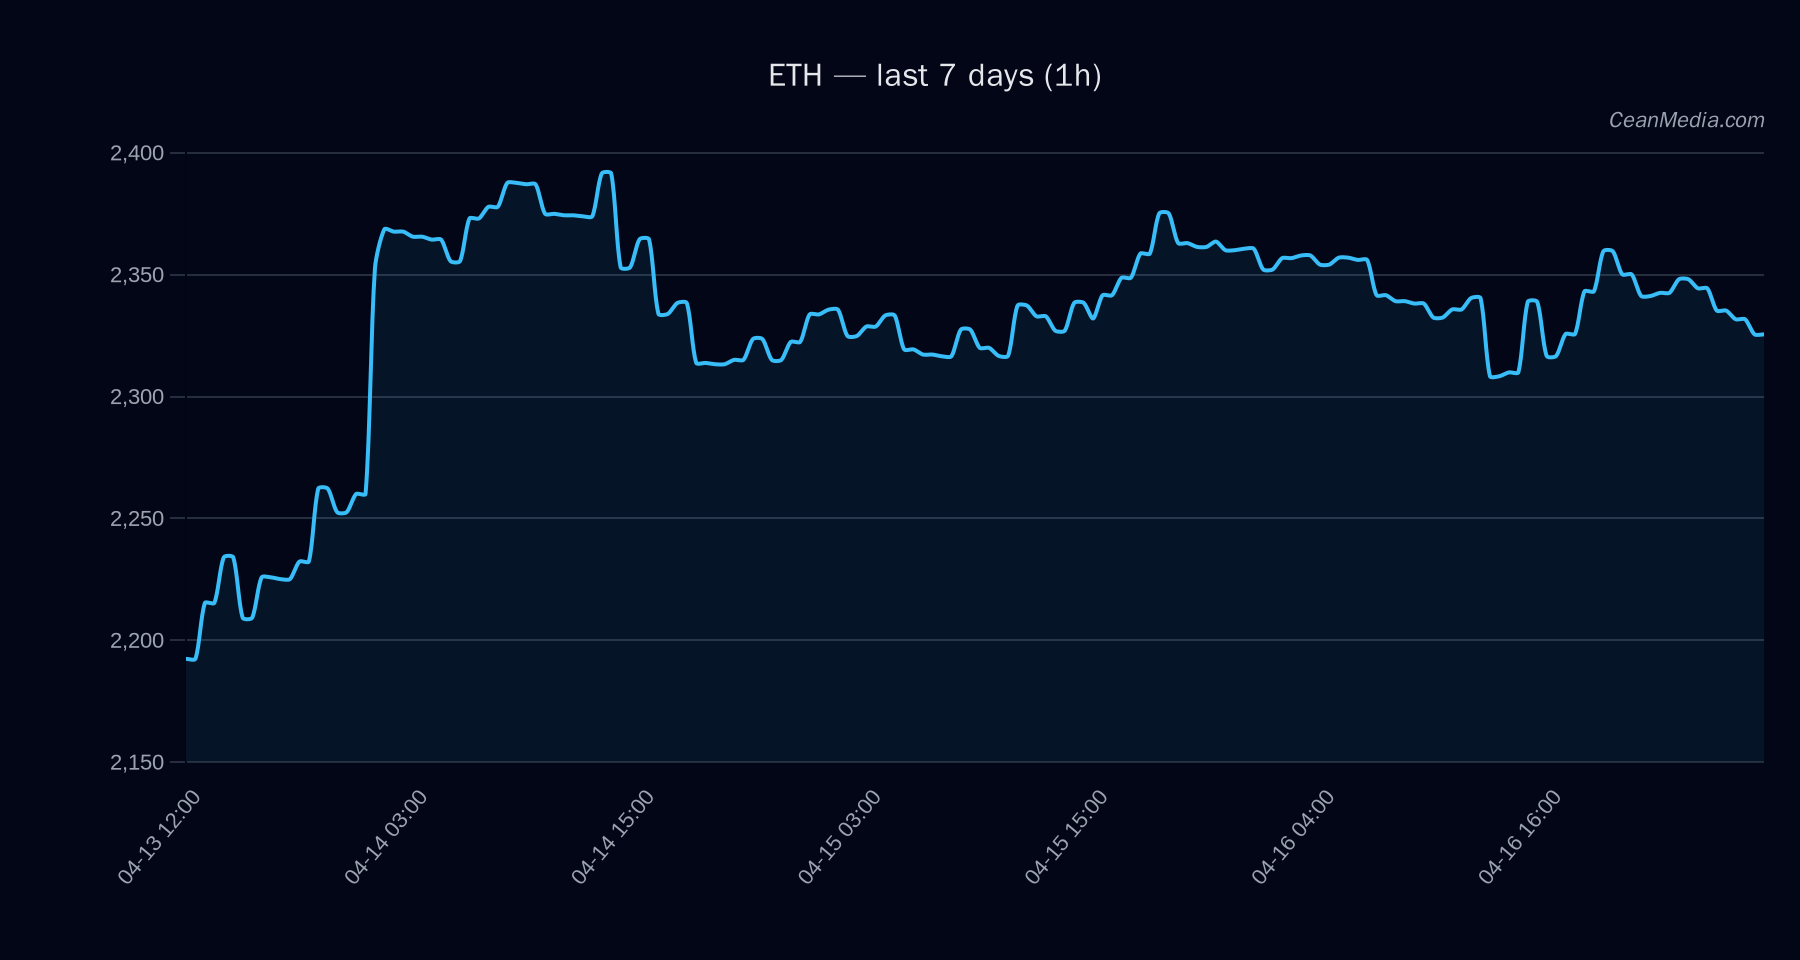
Ether (ETH) is trading near key support and resistance bands with a cautiously bullish short-term bias. Current price around 2,331.08, with a Short-Term Forecast: up at 51% probability. Market breadth remains constructive (Breadth>50h: 83%), while volatility is in a very low regime. BTC/ETH ETF flow data provides context but is not the primary driver for ETH pricing at this juncture.
Technical Analysis: ETH
Support at major 2,184; near-term support 2,284. Resistance at major 2,340; near-term resistance 2,378. Band 20–80% spans 2,333.75 to 2,665.62. - Current bias: Forecast: up (51%). Overall TA indicates sideways posture in the near term, with EMA12
- Price targets and triggers: Upside trigger: 1h close > 2,378 → potential move to 2,425.26–2,472.81. Invalidation/ downside case: 1h close < 2,284 → potential move to 2,238.77–2,193.08.
- Key levels to watch: Near-term support 2,284; near-term resistance 2,378. Break above 2,378 targets 2,425–2,473; break below 2,284 targets 2,239–2,193.
- Momentum indicators: RSI 46, EMA12
Drivers
TBI Z-SCORE (positive contribution), LIQ REL (negative), TBI EMA10 (negative). Other drivers include LS GLOBAL DELTA 24H and OI DELTA 24H with mixed signals. Overall momentum remains modest with a tilt toward risk-on in the near term. Vol regime: Very low, indicating subdued price swings and a tendency for range-bound movement around the specified bands. Inter-asset correlations (ρ BTC 72h ≈ 0.90) suggest ETH is still relatively aligned with BTC over the near term, but the ETF data implies caution in extrapolating BTC-led moves to ETH. ETF-related data shows positive and negative net flows across BTC/ETH, but ETH ETF flows are modest relative to total market activity, reinforcing that ETF activity is a contextual signal rather than a primary driver for ETH at present.
ETF Flows (BTC/ETH)
Contextual note: ETF flow data provided here covers BTC and ETH only. These figures are not intended as the primary signal for ETH price action but help describe broad market liquidity and sentiment backdrop.
1D: -$72.3M; 5D: +$145.0M; 10D: +$414.1M 1D: -$1.2M; 5D: +$136.0M; 10D: +$108.8M
Interpretation: The BTC ETF shows a recent negative move on the 1D window but longer-term inflows, while ETH ETF figures are modest and generally positive over 5–10 days. Taken together, ETF activity suggests a mixed liquidity backdrop with some risk-on sentiment developing over a multi-day horizon, but it should be weighed against on-chain and technical factors for ETH-specific decisions.
What to Watch Next
- Watch for a daily close above 2,378 to validate the upside potential toward 2,425–2,473.
- Monitor a daily close below 2,284 for potential leg down toward 2,239–2,193.
- Keep an eye on changes in market breadth and 72h BTC correlation to assess any shifts in risk sentiment that could influence ETH direction.
- Reassess if volatility regime shifts from very low to higher levels, which could precede more pronounced moves beyond current bands.
Hashtags: #ETH #Ethereum #CryptoAnalysis #TechnicalAnalysis #ETFFlows #MarketOutlook #TradingStrategy #CryptoNews #BTC #Altcoins #MarketSentiment