Market Snapshot
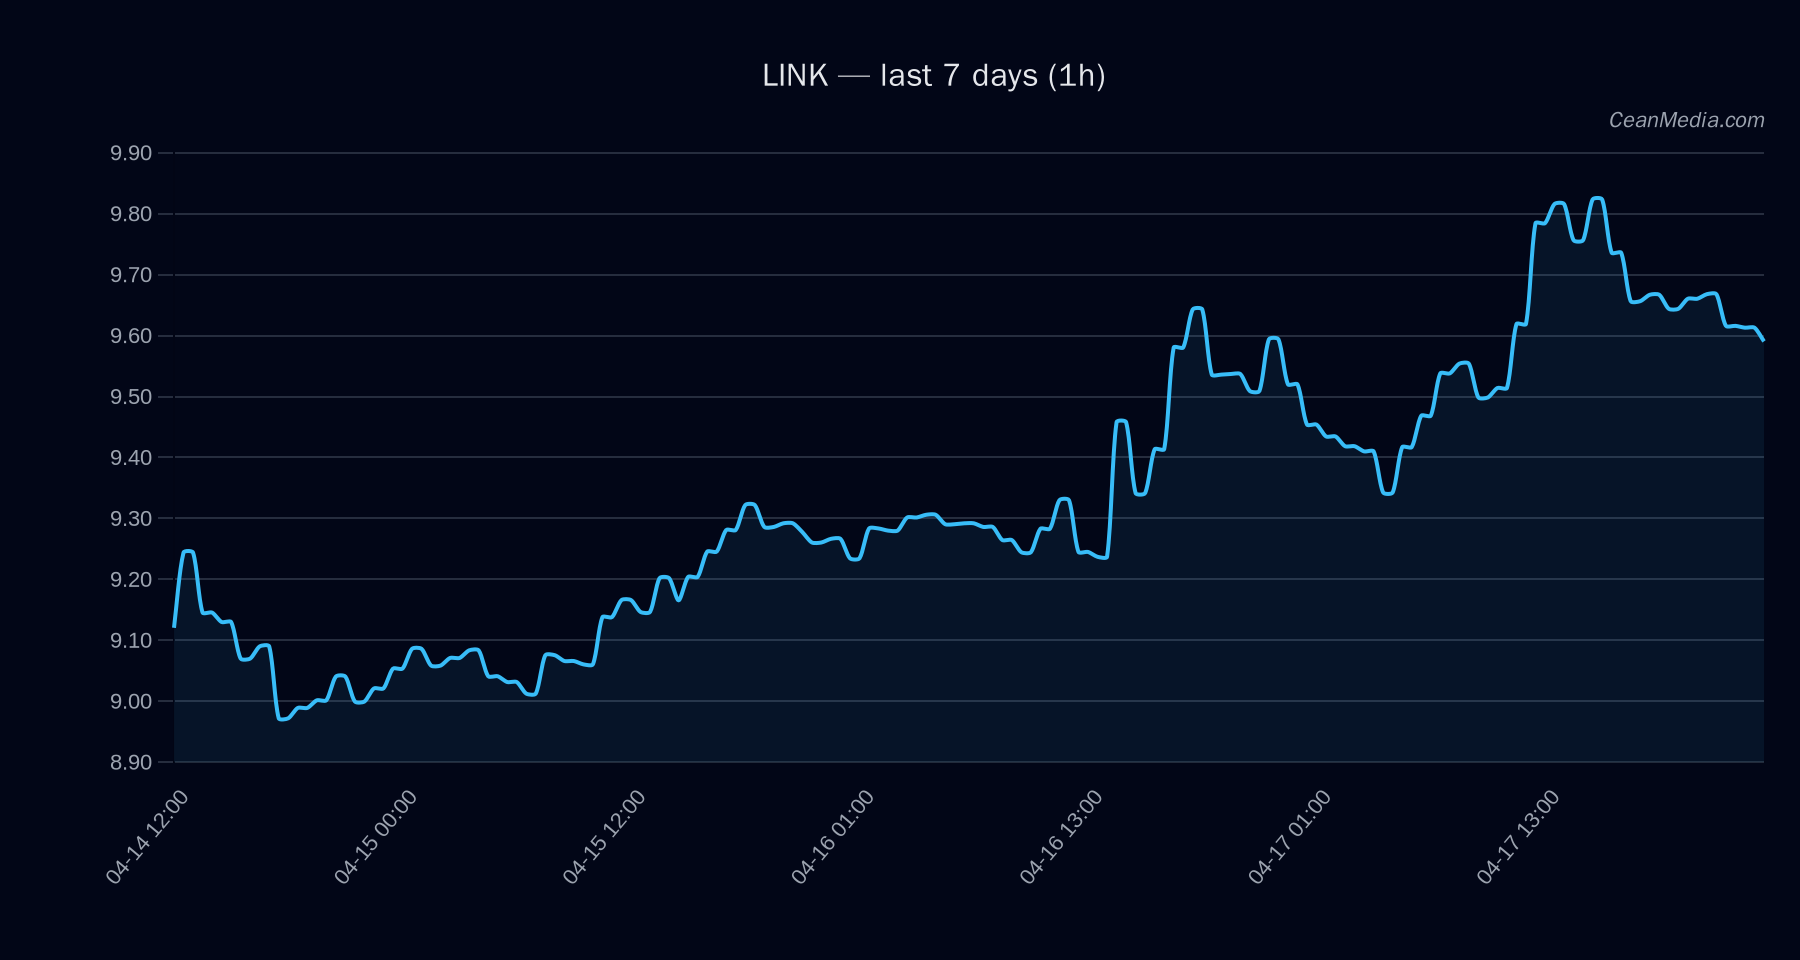
Price: 9.61. Short-term forecast indicates a modest bullish bias with a 52% probability of upside. The immediate range is bounded by key supports and resistances around 8.68 (major support) and 9.3–9.8 (near resistance). Current volatility is described as very low with a narrow band (P20–P80: 8.42–10.30) and RSI at 52, signaling neutral momentum.
- Band (P20–P80): 8.4225 – 10.3012
- Near-term support: 9.42; Major support: 8.68
- Near-term resistance: 9.8; Major resistance: 9.3
- Upside scenario: 1h close above 9.8 targets ~9.9982–10.1943
- Downside scenario: 1h close below 9.42 targets ~9.2294–9.0411
Technical Analysis: LINK
The primary technical view shows a bullish bias with EMA crossover confirmation (EMA12 > EMA26) and a bullish trend signal given by SMA50 > SMA200. RSI sits at 52, indicating neutral momentum, while volatility is very low. The chart suggests that a breakout above 9.8 would open a move toward the high-9s and potentially near-10.2 if momentum sustains. A break below 9.42 would shift attention to the lower 9.2–9.0 area.
Drivers
- Top drivers (quantitative): SPREAD BP (-3.14), SPREAD Z-SCORE (+1.18), LIQ IMB EMA12 (-0.8), LS GLOBAL DELTA 24H (-0.57), DEPTH LOG DELTA 24H (+0.29), DISTANCE FROM MA (-0.25)
- Bitcoin impact: BTC RETURN 24H (+0.03) and BTC trend signal (ρ 72h: 0.84) contribute to LINK’s directional context
- Market breadth: Breadth > 50h at 100% with very low volatility regime; Fear index (F&G) at 26
Overall, the forecast consolidates a 52% probability for upside in the next 24 hours, with neutral RSI indicating the need for a price-trigger to shift momentum.
ETF Flows (BTC/ETH)
Contextual note: ETF flow data presented here is for BTC and ETH only and is intended as macro-market context, not a primary signal for LINK. The flows indicate risk-on or risk-off tendencies depending on asset class leadership.
- BTC ETF: 1D +$9.4M; 5D +$226.7M; 10D +$495.8M
- ETH ETF: 1D +$29.3M; 5D +$166.5M; 10D +$139.3M
What to Watch Next
- Watch for a close above 9.8 to confirm the upside breakout scenario toward 9.9982–10.1943.
- Monitor a break below 9.42 for potential test of 9.2–9.0 support zone.
- Observe changes in BTC/ETH ETF flows as indicators of broader risk appetite, noting they are contextual rather than primary signals for LINK.
- Keep an eye on volatility regime; a shift from very low to higher regime may precede larger moves.
Hashtags: #LINK #CryptoAnalysis #TechnicalAnalysis #ETFFlows #BTC #ETH #MarketBreadth #Momentum #PriceAction