Market Snapshot
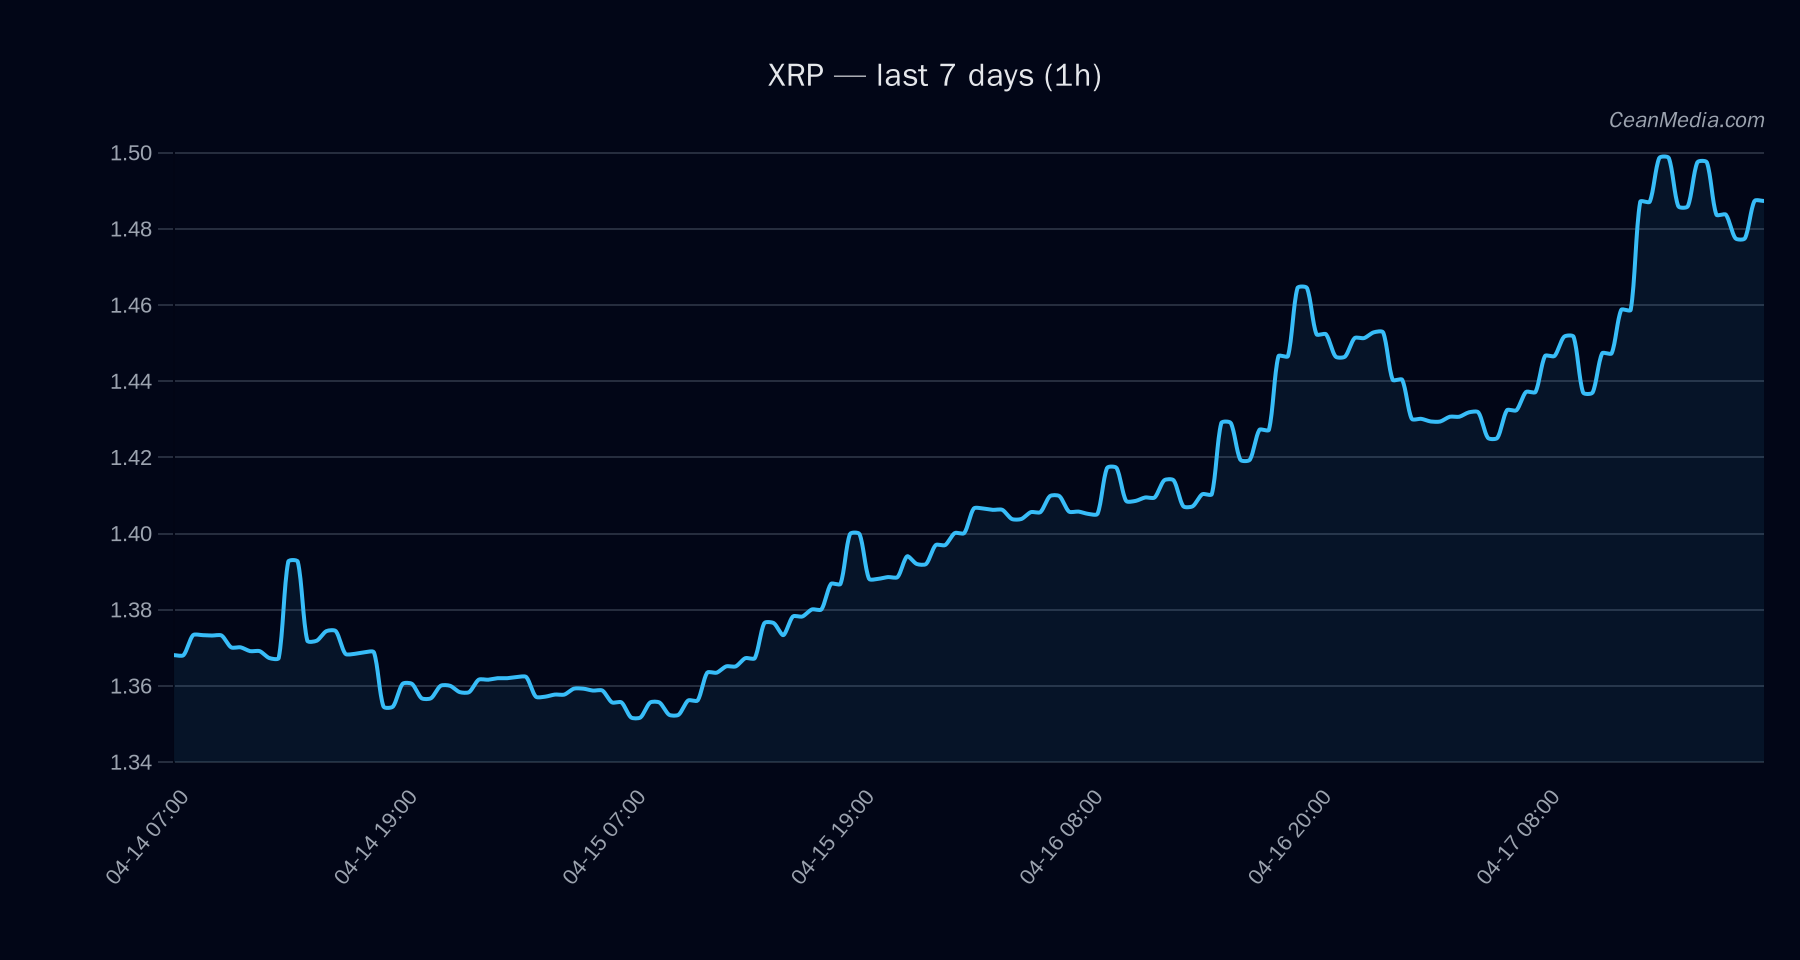
Current price: 1.4757 (as of 2026-04-17). Market sentiment for XRP shows a bullish tilt in the near term, with a short-term forecast labeled as up. Volatility remains very low and breadth indicators are constructive, though notable intra-day support and resistance levels define a tight trading range around 1.44–1.50.
Technical Analysis: XRP
XRP sits between major support at 1.32 and near-term resistance at 1.50. A close above 1.50 would skew upside targets toward ~1.5353–1.5654; a close below 1.44 would open a path toward ~1.4173–1.3883. EMA12 > EMA26 and SMA50 > SMA200, with RSI at 59. Overall TA indicates bullish bias in the immediate term. Price band (P20–P80) is 1.4731–1.5875, implying current price sits near the lower-middle of the expected range. Major support 1.32; near-term support 1.44. Major resistance 1.4; near-term resistance 1.5. Forecast: up (45% probability in the provided horizon). The distribution across outcomes shows Upside 45%, Sideways 16%, Down 39% for the 24-hour view. Vol regime: Very low; RSI 59 indicates neither overbought nor oversold at this moment. Break > 1.50 triggers upside range 1.5353–1.5654; break < 1.44 triggers downside range 1.4173–1.3883.
Drivers
- Top drivers point to a mixed but mildly constructive near-term momentum with emphasis on spread and basis metrics (Spread Z-score, LS Top Z-score) contributing positively to directional bias.
- Key contributors include ETF-style momentum signals (BTC-related) but with a notable caveat: XRP-specific drivers currently show stronger price mechanics (EMA slope, basis z-score) than external liquidity factors at this horizon.
- BTC-related signals show positive 24H returns and a stable vol regime context, though vol-of-vol remains limited, consistent with the very low volatility environment.
ETF Flows (BTC/ETH)
Contextual flows for BTC and ETH ETFs are provided as market breadth context rather than XRP-specific signals. Recent data shows clean net inflows across the main BTC and ETH ETFs over 1D, 5D, and 10D horizons, suggesting a supportive risk-on backdrop for risk assets. This information should be interpreted as macro-market context rather than a primary driver for XRP price action.
: 1D +$9.4M | 5D +$226.7M | 10D +$495.8M : 1D +$29.3M | 5D +$166.5M | 10D +$139.3M
What to Watch Next
- Monitor a close above 1.50 to validate the upside breakout target range of 1.5353–1.5654.
- Watch for a break below 1.44 to confirm downside risk toward 1.4173–1.3883.
- Keep an eye on RSI movement and the EMA12/EMA26 crossover dynamics as additional confirmatory signals for the near-term bias.
- Assess broader market risk-on/risk-off shifts via BTC/ETH flows but treat them as background context for XRP rather than a primary signal.
Hashtags: #XRP #CryptoAnalysis #TechnicalAnalysis #BTCFlows #ETHFlows #MarketSnapshot #TradingSetup #CryptoMarkets #RiskOn #PriceAction #Liquidity