Market Snapshot
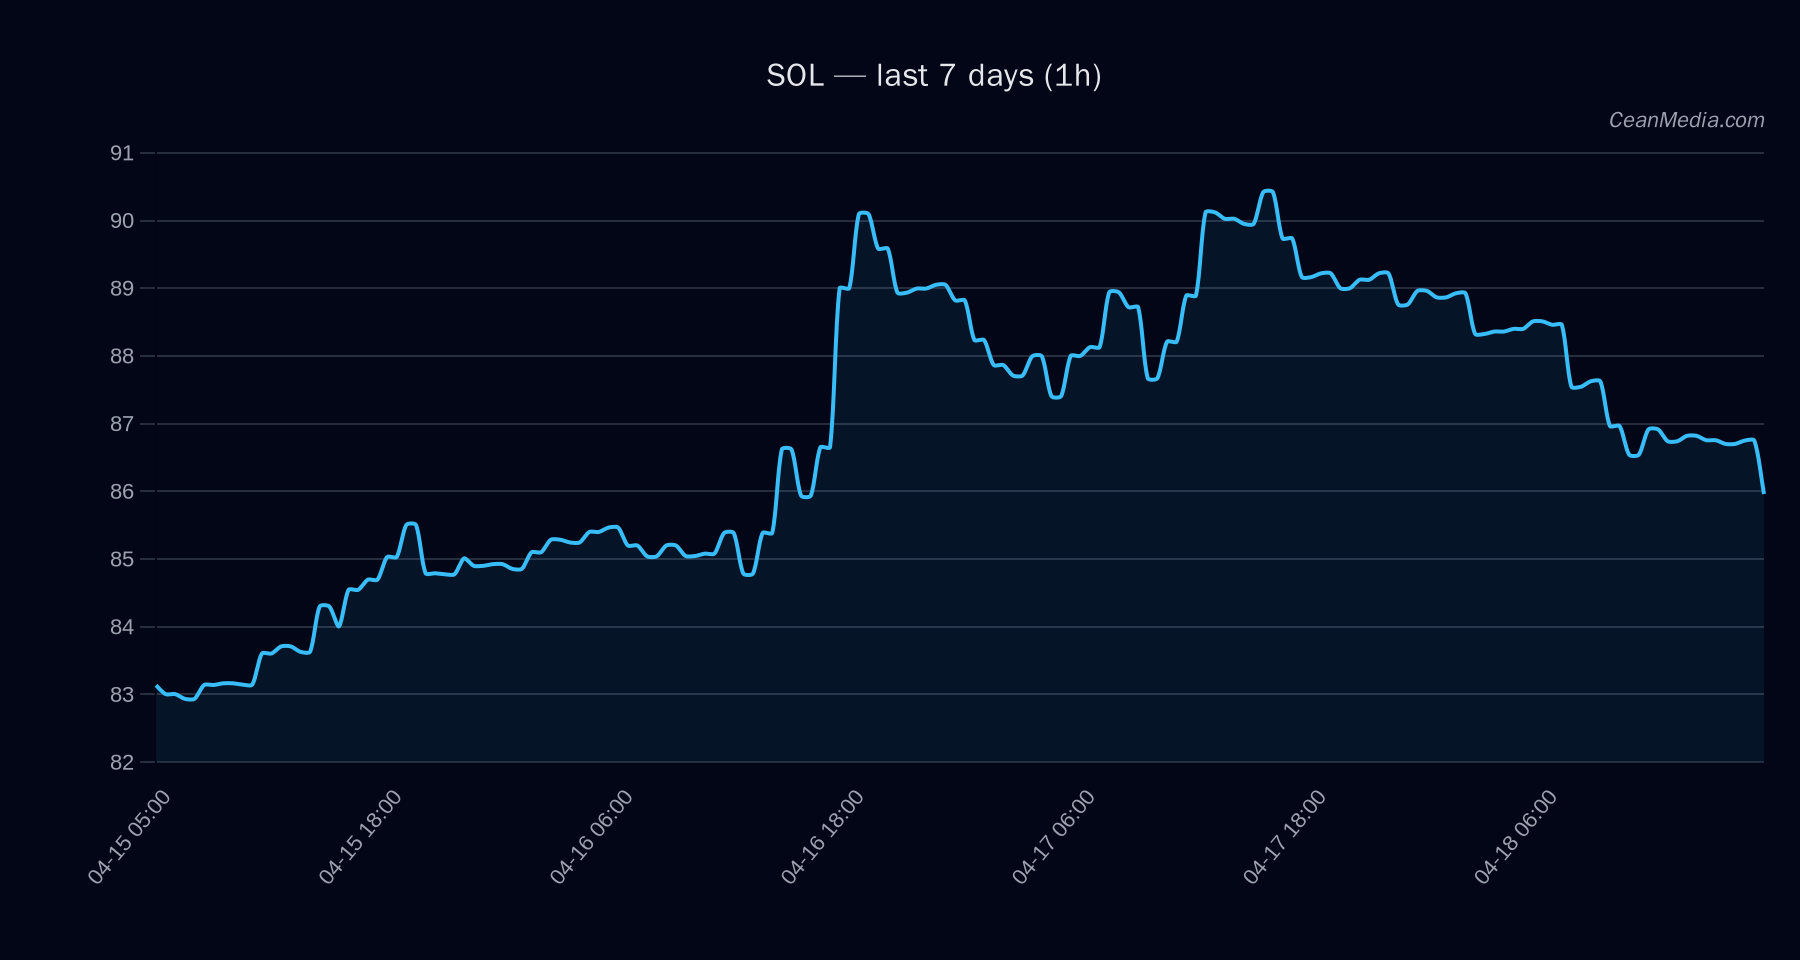
Solana (SOL) traded around the mid-80s, holding between key support and resistance levels. The price on the latest read is 86.16, with a short-term forecast biased to the upside but characterized by a narrow band and very low volatility. Market breadth is weak, and momentum indicators show oversold tendencies near term. ETF flow data is provided for BTC and ETH as contextual signals, not a primary driver for SOL price action.
Technical Analysis: SOL
86.16 Up (55%) P20–P80 81.42 – 97.30; P50 88.18 Support 82 (major), 84.4 (near); Resistance 87.3 (major), 87.9 (near) EMA12
The TA notes a sideways context with a tilt toward upside, but the RSI remains in oversold territory, suggesting room for a reaction given the current support zone.
Drivers
- Top Z-Score signals: LS TOP Z-SCORE positive contribution (2.13) but LS GLOBAL Z-SCORE negative contribution (-2.12) with a different value context
- Spread basis: modest positive influence (BP 1.35)
- Global delta metrics (24h) and top delta: mixed signals; global delta positive, top delta negative
- BTC relative cues: BTC RV 24h negative; BTC volatility regime indicates low/soft regime
- Depth USD (10bp log1p) and other order-book signals provide minor influences
- Overall trend strength and distance from moving averages imply a cautious stance with potential for a breakout if key levels are cleared
Net: The driver mix points to a cautious, tilt-to-up scenario within a narrow range, contingent on price action around the 84.4–87.9 band.
ETF Flows (BTC/ETH)
Context: ETF flow data provided for BTC and ETH is included to gauge broader risk sentiment and macro liquidity positions. The data shows positive ETF inflows for both BTC and ETH on the reported horizons, suggesting risk-on appetite in related markets. It is important to emphasize that these flows are context for BTC/ETH and not a primary signal for SOL pricing.
- BTC ETF: +$350.8M (1D), +$346.2M (5D), +$933.8M (10D)
- ETH ETF: +$100.7M (1D), +$190.8M (5D), +$231.1M (10D)
Interpretation: The BTC/ETH ETF inflows indicate ongoing risk appetite and liquidity support in the broader crypto market. While supportive of a constructive backdrop, these inflows do not constitute SOL-specific trading signals and should be viewed as macro-context signals for market sentiment.
What to Watch Next
- Key resistance at 87.9 and embedded trendlines—break above or below important bands to confirm near-term direction
- Watch 84.4 for potential downside constraint; a close below could expose the 82–81 zone
- Monitor volatility regime and RSI for signs of a momentum shift from oversold to neutral
- Keep an eye on BTC/ETH ETF flow momentum as broad market liquidity can influence risk-on/off transitions
Hashtags: #Solana #SOL #CryptoAnalysis #TechnicalAnalysis #ETFFlows #BTC #ETH #MarketSnapshot #PriceAction #TradingStrategy