Market Snapshot
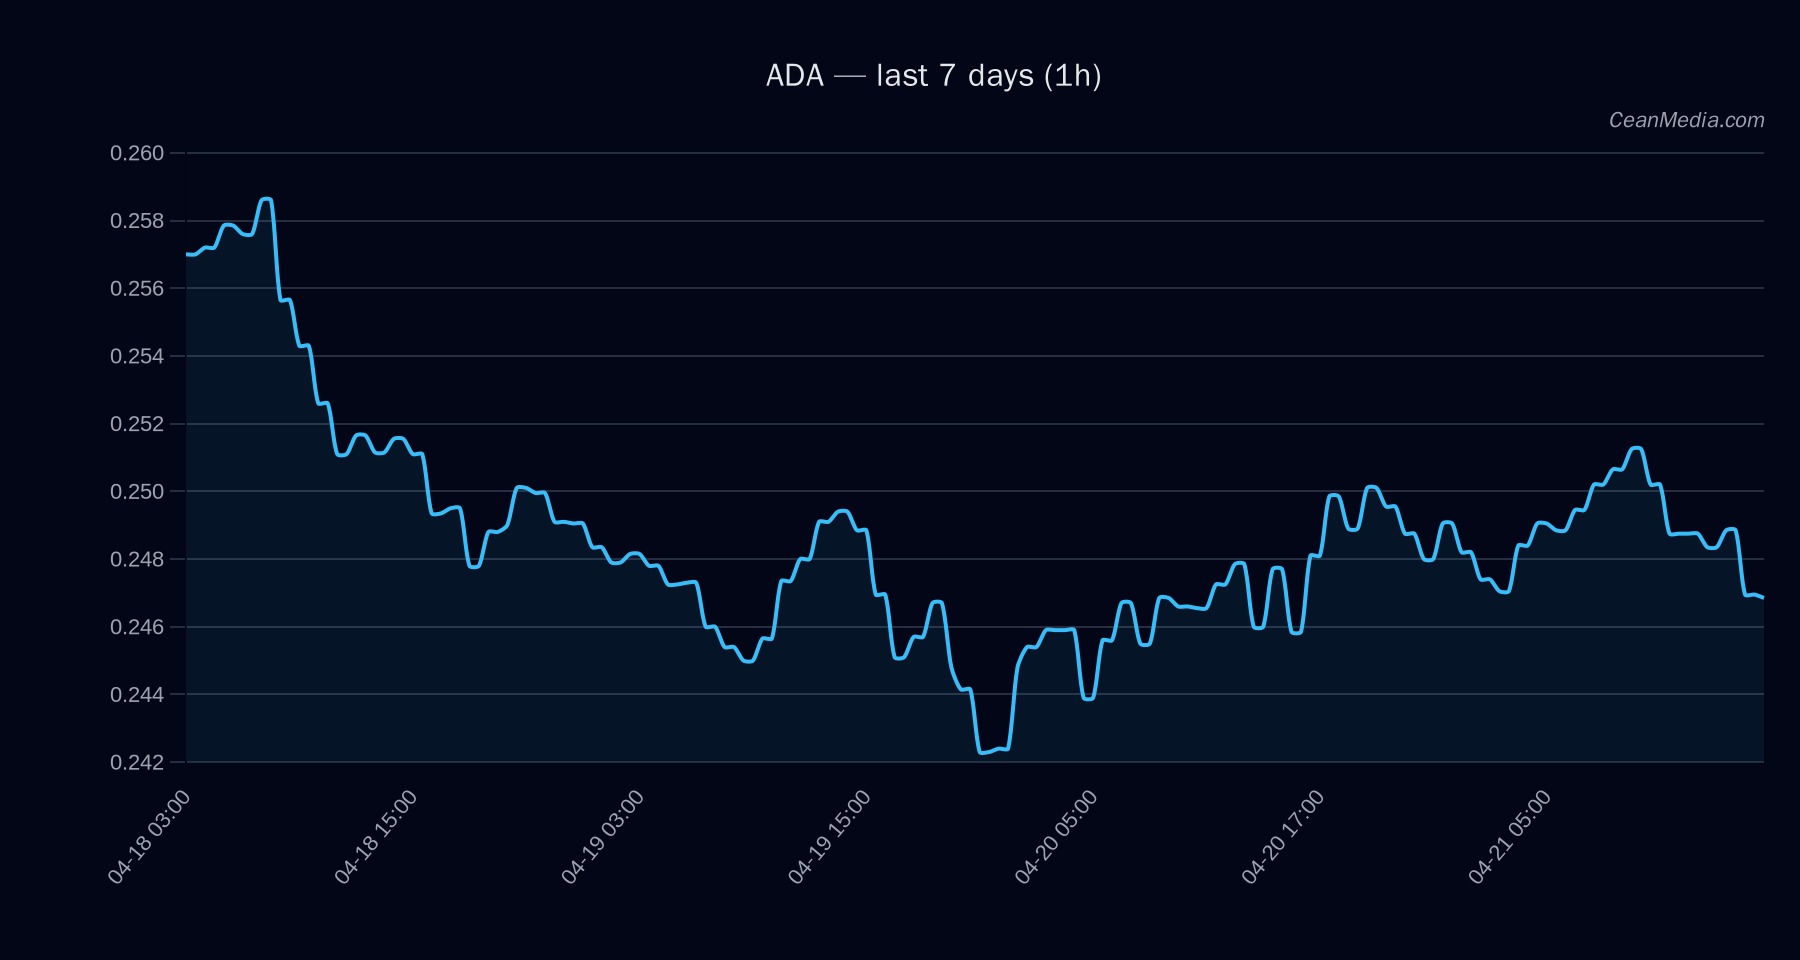
Cardano (ADA) trades near 0.2474, with the near-term setup showing a range-bound configuration between major support at 0.24 and resistance at 0.26. The latest forecast indicates a leaning toward upside bias, supported by a market-wide breadth signal and low volatility regime.
Technical Analysis: ADA
- Current price: 0.2474
- Short-Term Forecast: Up (49%)
- Key levels: Support 0.24 (Major/Near); Resistance 0.25 (Near); Major Resistance 0.26
- Trends and indicators: EMA12>EMA26; SMA50
- Band: P20–P80 = 0.2386–0.2521; P50 = 0.2444
- Upside/Break scenarios: Break > 0.25 targets 0.2574–0.2624
- Downside/Break scenarios: Break < 0.24 targets 0.2376–0.2328
- Bias: Neutral-to-up with upside probability around 49% in the near term
- Invalidation: A move decisively below 0.24 would increase the likelihood of a test toward 0.2376–0.2328; a sustained close above 0.25 supports the 0.2574–0.2624 path.
Drivers
- Top contributors include spread metrics and z-scores, with net mixed signals: LS TOP Z-SCORE negative contribution (-1.08) despite value strength; SPREAD BP positive; BASIS Z-SCORE negative; RV 7D modestly negative; LIQ IMB Z-SCORE strongly positive.
- Momentum signals show modest trend strength (trend_strength ~0.63) but overall low volatility regime emphasizes range play.
- Return over 24h is near flat (-0.012), EMA slope is flat-to-down slightly, and vol regime is Very Low, reinforcing a cautious stance on breakout confidence.
ETF Flows (BTC/ETH)
This section summarizes ETF flow context for BTC and ETH, which provides macro-market sentiment but should not be used as a primary signal for ADA price action. Current data indicates noticeable inflows for BTC and ETH ETFs over different horizons:
- BTC ETF: 1D +$238.4M, 5D +$1.18B, 10D +$1.45B
- ETH ETF: 1D +$75.3M, 5D +$295.5M, 10D +$408.7M
Interpretation: The ETF flows suggest a broader risk-on backdrop and institutional participation in BTC/ETH, which can indirectly influence risk sentiment in crypto markets. However, ETF data is context and not a primary signal for ADA-specific moves.
What to Watch Next
- Monitor whether ADA breaks above 0.25 to validate the 0.2574–0.2624 upside range.
- Watch for a sustained move below 0.24, which could accelerate a test toward 0.2376–0.2328.
- Track broader market breadth and volatility signals for any shift from the current very-low regime.
- Keep an eye on BTC/ETH ETF inflows as a context for overall market risk posture, while focusing on ADA-specific technicals for trading decisions.
Hashtags: #ADA #CryptoAnalysis #TechnicalAnalysis #MarketSnapshot #ETFFlows #BTC #ETH #RiskOn #PriceAction #Liquidity #TradingSignals #CryptoMarkets