Market Snapshot
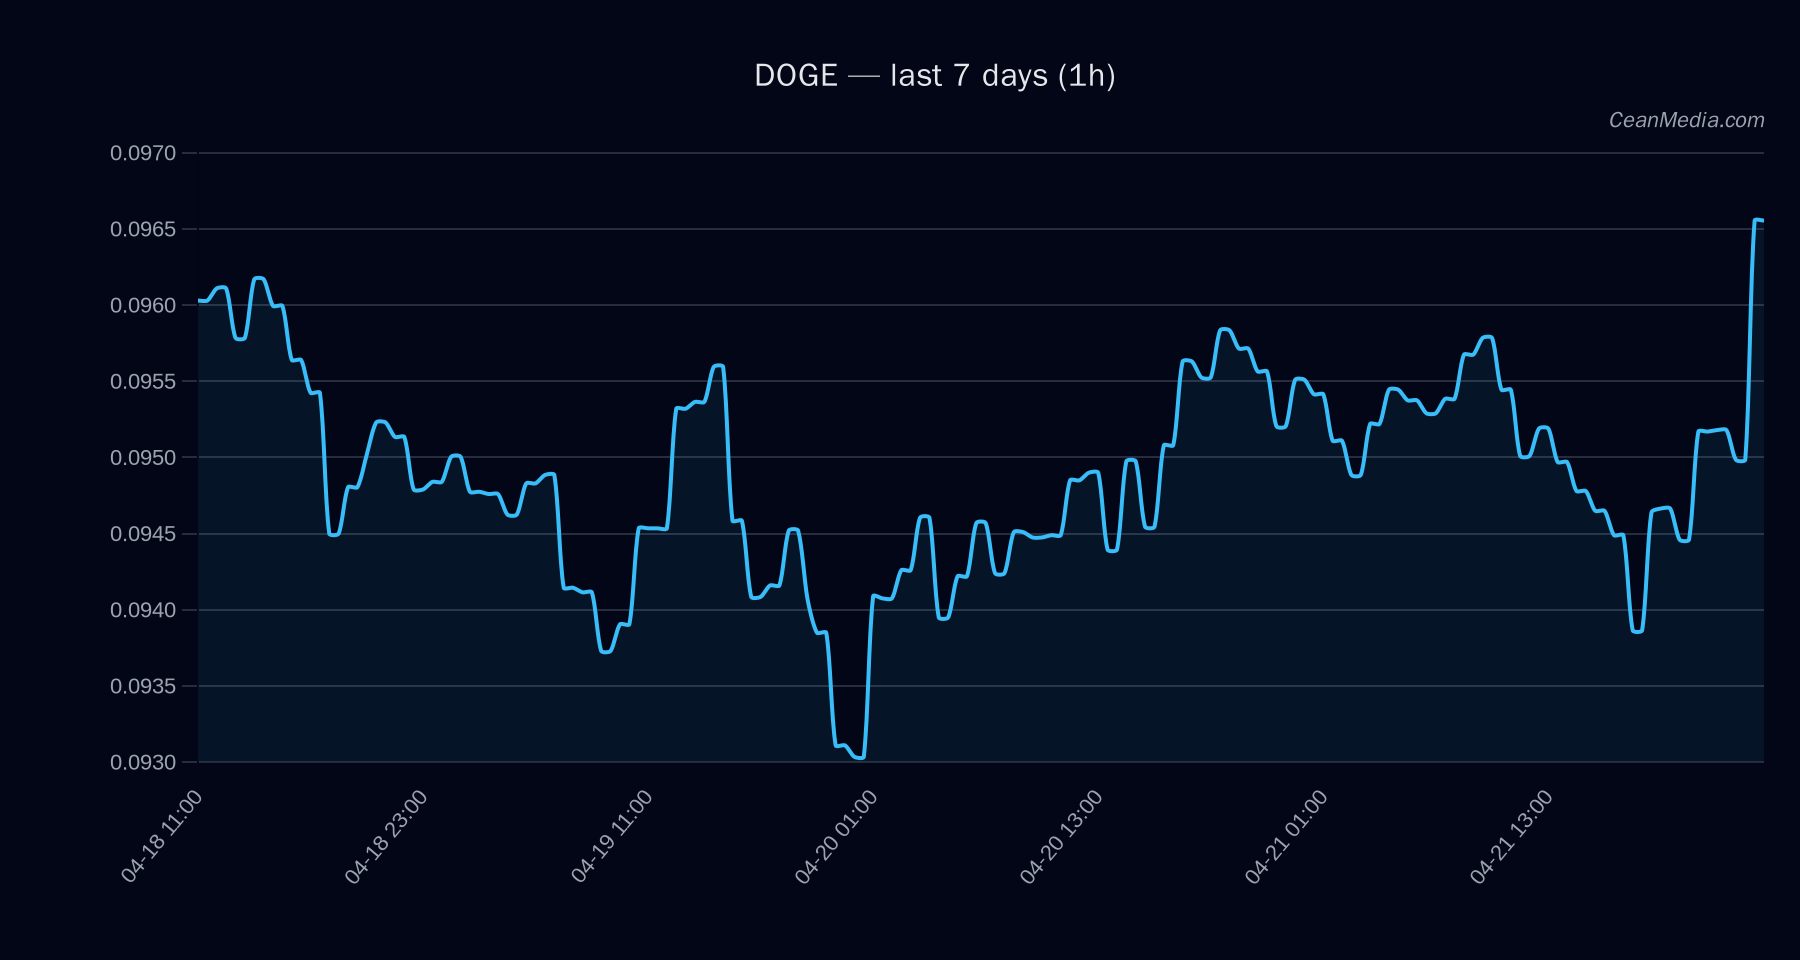
DOGE/USD is trading near critical support and resistance levels with a short-term bullish tilt reflected in a 51% probability of an upward move. The pair sits at approximately 0.0963, with a nearby support band around 0.091–0.094 and a near-term resistance around 0.097–0.098. The current context includes very low volatility with a 24-hour volatility regime described as Very low, and breadth conditions suggesting breadth > 50h at 100%.
Contextual macro signals show Bitcoin dominance at 57.8% with a modest uptrend over a 7-day horizon, and BTC-related ETF flows in positive territory over multiple horizons, indicating a broader risk-on backdrop that may influence crypto sentiment indirectly.
Technical Analysis: DOGE
Short-term forecast is up (51% probability). Price trades between major support 0.091 and major resistance 0.097, with the band from 0.0902 to 0.1016. Support: 0.091 (major), 0.094 (near); Resistance: 0.097 (major), 0.098 (near). Break above 0.098 targets 0.1002–0.1022. Break below 0.094 targets 0.0925–0.0906. Upside trigger: 1h close > 0.098 (target 0.1002–0.1022). Invalidation: 1h close < 0.094 (target 0.0925–0.0906). If price fails to sustain above 0.098 or breaks below 0.094, near-term risk may shift toward a consolidation or a deeper pullback toward 0.090–0.092 range.
Drivers
- Top Twitter/Topline signals indicate 24-hour return modestly positive (0.02) and a small EMA slope contribution (0.0027).
- Funding Z-Score is negative (-0.17), while Basis Z-Score is positive (0.21), suggesting marginally constructive price basis against funding signals.
- Order-book imbalance (EMA5) contributes positively (0.04), indicating potential near-term buying pressure.
- Bitcoin-related signals: BTC 24h return around 0.03, with BTC volatility regime indicating low-to-moderate activation, contributing to overall market context.
- Overall trend strength metric sits above 0.6, supporting a cautious up-move bias in the near term within a very tight volatility regime.
ETF Flows (BTC/ETH)
The reported ETF flows for BTC and ETH are included as contextual market signals. BTC ETF flows show positive momentum across 1D, 5D, and 10D horizons (e.g., +$238.4M/1D, +$1.18B/5D, +$1.45B/10D). ETH ETF flows also display positive numbers across similar horizons (+$75.3M/1D, +$295.5M/5D, +$408.7M/10D).
Important note: ETF data is BTC/ETH-centric and should be interpreted as context for risk-on/off sentiment rather than a primary signal for DOGE pricing. DOGE-specific signals and TA remain the primary basis for trading decisions; ETF flows provide macro-market ambiance that can influence risk appetite and cross-asset correlations.
What to Watch Next
- Watch for a daily close above 0.098 as a trigger for potential acceleration toward 0.1002–0.1022.
- Monitor sustained moves below 0.094, which could shift the bias toward the 0.0925–0.0906 zone.
- Observe changes in BTC/ETH ETF flow momentum as a broader risk-on/off signal that could impact altcoins, including DOGE.
- Keep an eye on volatility regime shifts; a rise from Very low could accompany larger price moves and breakouts.
Hashtags: #DOGE #CryptoAnalysis #TechnicalAnalysis #MarketSnapshot #ETFFlows #BTC #ETH #Altcoins #RiskOn #TradingView #PriceAction