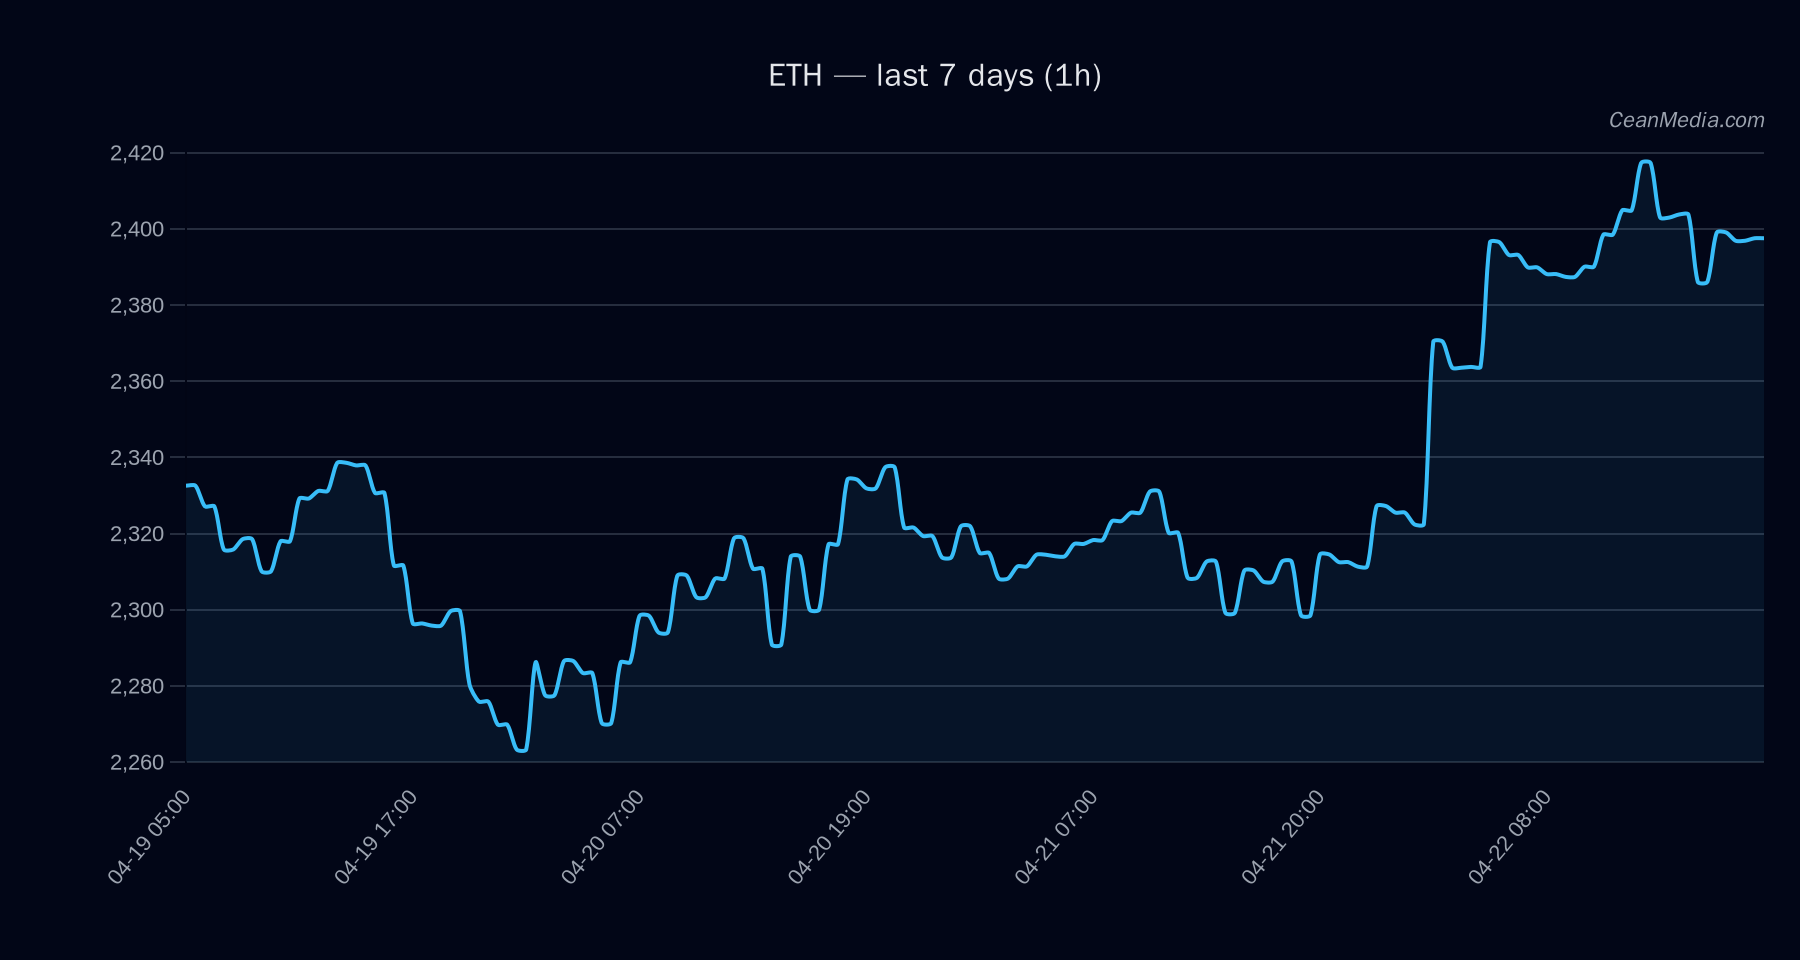
Market Snapshot
ETH trades around the mid-2,300s, with the immediate framework defined by a visible support at 2,282 (major) and resistance at 2,376 (major). The short-term forecast indicates a leaning bias toward upside with a 50% probability, set against a backdrop of very low volatility and neutral RSI dynamics.
- Price: 2,397.03
- Short-Term Forecast: Up (50%)
- RSI: 61
- Vol Regime: Very Low
- Band (P20–P80): 2,299.67 – 2,449.59
Technical Analysis: ETH
- Bias and Key Levels: ETH sits between the critical support of 2,282 and resistance of 2,376. A break above 2,444 would open a path toward 2,493.87–2,542.77. A break below 2,350 targets 2,302.11–2,255.13.
- Momentum Indicators: EMA12 > EMA26 and SMA50 < SMA200 suggest a mixed up-side tilt in the near term. RSI at 61 is neutral to mildly bullish.
- Volatility: σ24h at 0.59% indicates very low volatility, limiting large intraday swings in the near term.
- Forecast Summary: 50% probability of an upward move within the next 24 hours, with a sideways-to-up bias given current indicator alignment.
- Invalidation/Triggers: Break above 2,444 is a bullish trigger toward 2,493.87–2,542.77; break below 2,350 is a bearish trigger toward 2,302.11–2,255.13.
Drivers
LS Top Z-Score (-3.16 contrib; value -6.79) and LS Global Z-Score (-1.54 contrib; value -4.73) indicate mixed breadth signals; larger negative inputs suggest caution on broader risk appetite. OI Delta 24H and LS Global Delta 24H show negative contributions despite positive price context, highlighting mixed positioning versus price. Distance from MA at modest positive levels (value 0.86) and spread metrics showing modest imbalances. BTC–ETH correlation remains elevated (ρ 0.87 over 72h), indicating BTC-driven momentum can influence ETH moves in the near term.
ETF Flows (BTC/ETH)
ETF flow data provided here is explicitly for BTC and ETH only and should be considered contextual information rather than a primary signal for ETH price action. Current read shows:
1D -$5.5M; 5D +$771.3M; 10D +$987.9M 1D +$37.5M; 5D +$281.9M; 10D +$340.4M
The ETH ETF inflows over multiple horizons suggest a modestly constructive backdrop for broad-market participation in ETH, but the data must be interpreted in the context of BTC-driven risk-on/off dynamics and not as a stand-alone ETH price signal.
What to Watch Next
- Watch for a close above 2,444 to verify upside continuation toward the 2,493.87–2,542.77 zone.
- Monitor a break below 2,350 for potential acceleration toward 2,302.11–2,255.13.
- Observe changes in BTC/ETH correlation and breadth signals as a read on market risk appetite.
- Track ETF flow dynamics for BTC and ETH as supplementary context to price action, not as primary drivers for ETH moves.
Hashtags: #ETH #Ethereum #CryptoMarkets #TechnicalAnalysis #ETFFlows #MarketSnapshot #PriceAction #Volatility #CryptoNews #TradingIdeas #Bitcoin #AltCoins