Market Snapshot
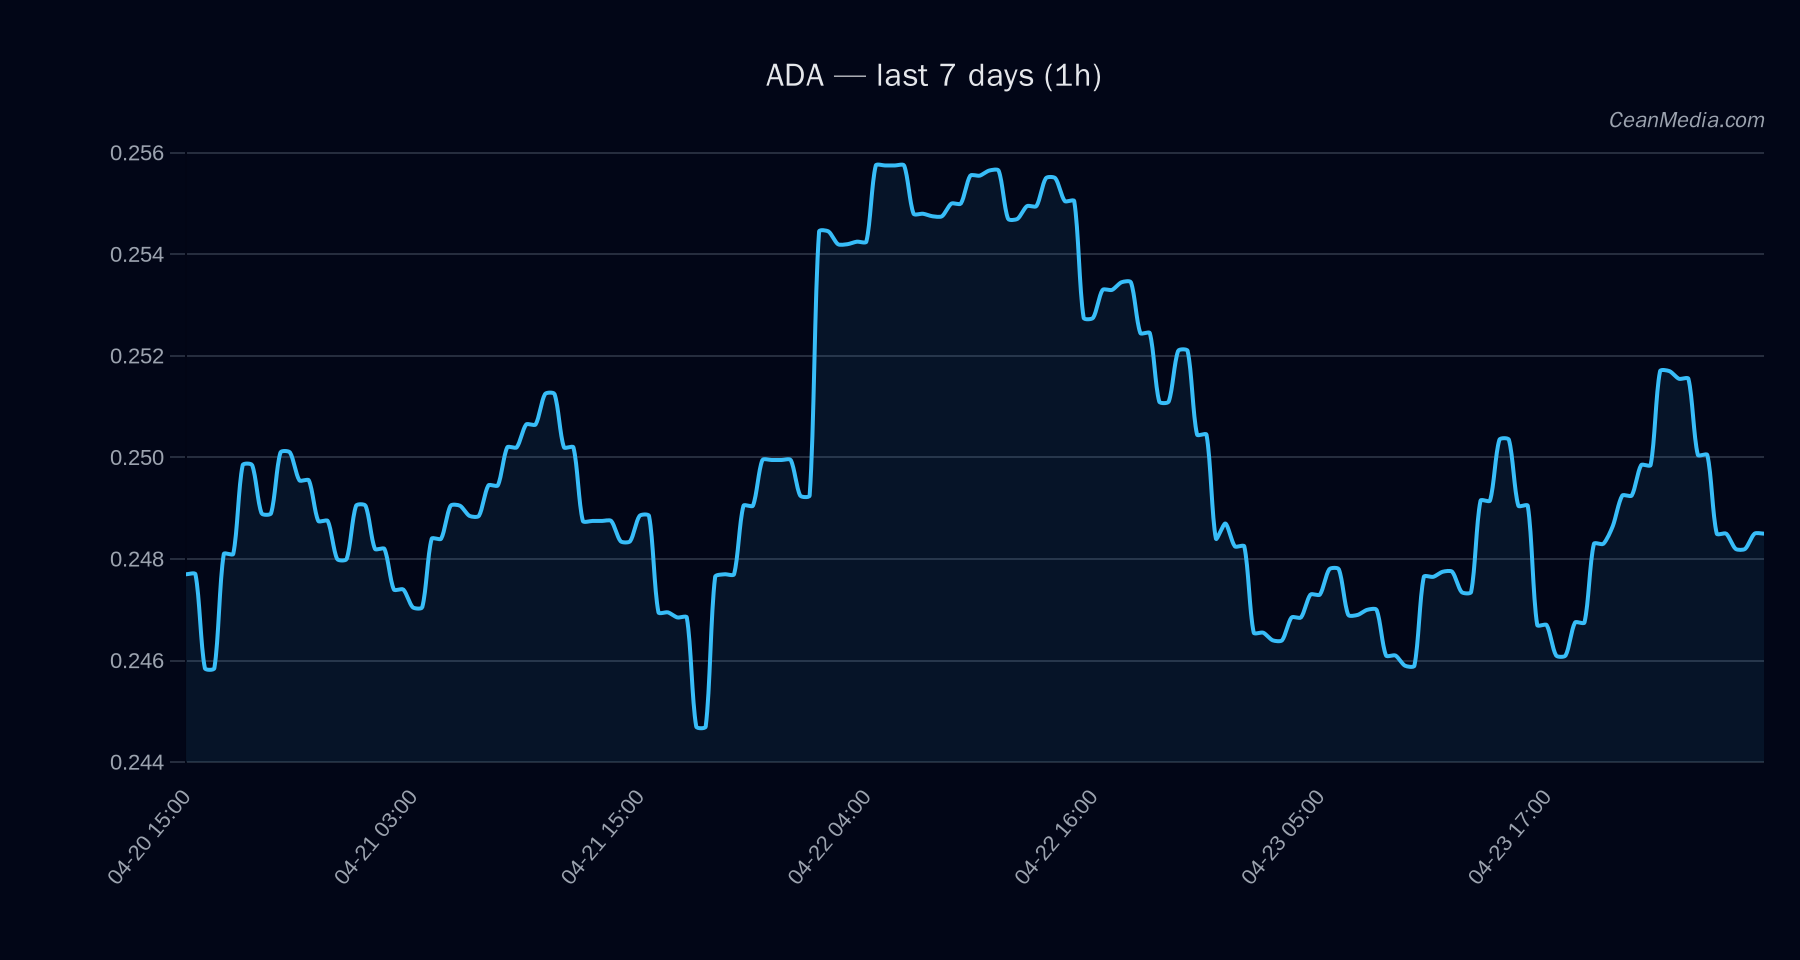
On 2026-04-24, Cardano (ADA) trades near key support and resistance levels with a cautious short-term bias. The price is around 0.2488, with a band between 0.2404 and 0.2583 (P20–P80). The nearby major support sits at 0.24 and resistance at 0.26. The 1-hour upside breakout above 0.255 would open a path toward the 0.2589–0.2639 range, while a break below 0.245 would target 0.2389–0.2341. Market breadth indicators show very low volume and a consolidated regime, implying limited conviction in one-direction moves for now.
Technical Analysis: ADA
- Current price: 0.2488
- Short-Term Forecast: Up (48%)
- Key levels: Support 0.24 (Major), 0.245 (Near); Resistance 0.26 (Major), 0.255 (Near)
- Trend indicators: EMA12 > EMA26, SMA50 < SMA200
- Momentum: RSI 49 (neutral)
- Volatility: σ24h 0.45%, Vol regime: Very low
- Forecast: Up with a 48% probability; TA describes a sideways bias within the current range
Break targets to watch:
1h close > 0.255 → 0.2589–0.2639 - Downside trigger: 1h close < 0.245 → 0.2389–0.2341
Invalidations and caveats: The volatility regime is very low, suggesting limited breakout potential unless new catalysts emerge. RSI remains near neutral, and price action is largely range-bound within the defined support and resistance.
Drivers
- Spread BP: +0.8 (value 2.34)
- RV 7D: +0.73 (value -1.82)
- Spread Z-Score: -0.69 (value -5.34)
- TBI REL: -0.31 (value 4.03)
- LIQ IMB Z-Score: +0.24 (value 3.98)
- Depth Z-Score: +0.23 (value 2.57)
- TBI EMA10: -0.22 (value -3.82)
- LS TOP DELTA 24H: -0.21 (value -0.82)
Other context figures: ρ(BTC,72h) = 0.86, ALT breadth ex-mega = 0%, Fear index around 39, BTC.D at 58.1% with a +1.1%/7d move. ETF-focused flows for BTC/ETH show mixed signals and should be interpreted as context rather than a primary ADA signal.
ETF Flows (BTC/ETH)
The reported ETF flows are specific to BTC and ETH and provide market-wide risk-on/off context rather than a direct signal for ADA. The data shows:
- BTC ETF: +$50.6M (1D), +$1.01B (5D), +$1.23B (10D) – net positive demand recently.
- ETH ETF: -$64.1M (1D), +$212.8M (5D), +$379.3M (10D) – mixed near-term with larger longer-dated inflows.
Interpretation: The BTC/ETH ETF data reflects broader risk-on appetite and capital shifts within the crypto market, which can influence liquidity and correlation dynamics. However, this information is context only and should not be treated as a primary signal for ADA trading decisions.
What to Watch Next
- Monitor for a close above 0.255 on short timeframes to target 0.2589–0.2639.
- Watch for a break below 0.245 to anticipate a move toward 0.2389–0.2341.
- Observe volatility regime as it shifts from very low to higher levels, which could precede breakouts.
- Keep an eye on BTC/ETH ETF flow momentum for systemic risk-on/off cues, while recognizing they are contextual for ADA.
Hashtags: #ADA #Cardano #CryptoAnalysis #MarketSnapshot #TechnicalAnalysis #ETFFlows #BTC #ETH #CryptoMarkets #PriceAction #Volume