Market Snapshot
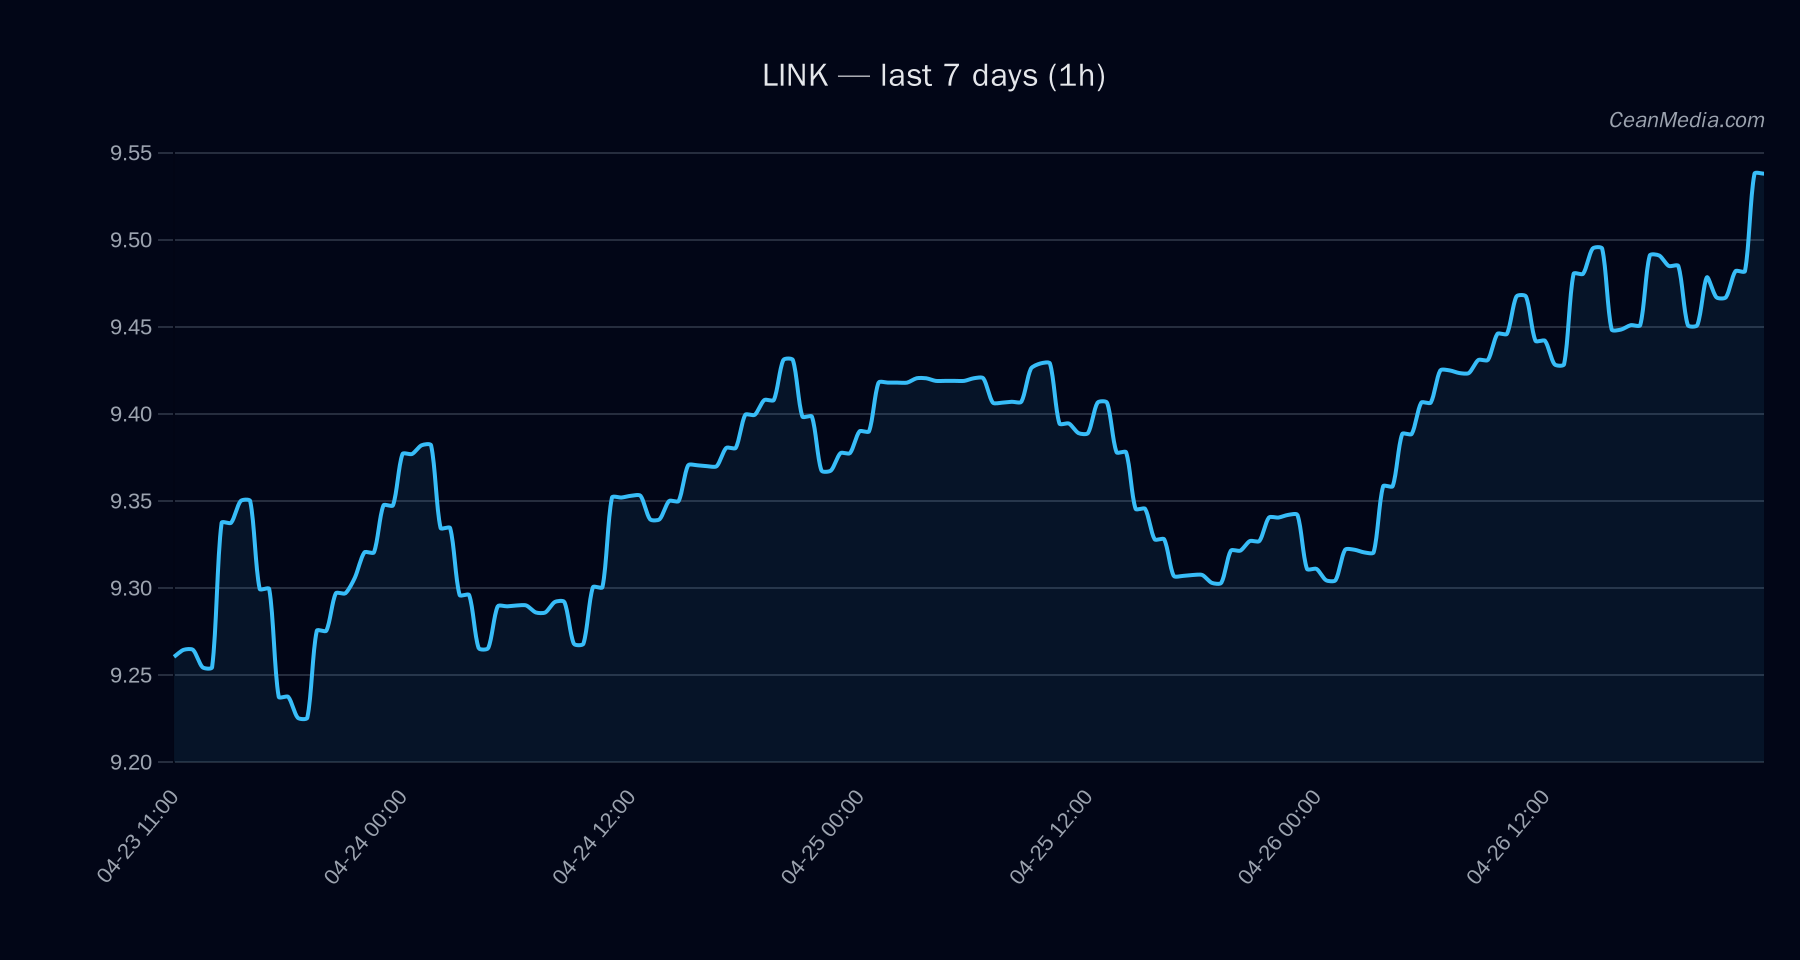
On 2026-04-27, LINK is trading around 9.5 with a short-term bullish tilt based on technical structure. The instrument sits between key support at 9.32 and resistance at 9.72, with a potential upside toward 9.90–10.10 if the near-term breakout occurs. Overall volatility is described as very low, and the prevailing trend signals are consistent with an upside bias in the near term.
Technical Analysis: LINK
Forecast indicates an up bias (54% probability) with RSI around 65, EMA12>EMA26, and SMA50>SMA200. Vol regime classified as Very low, suggesting a subdued volatility environment. Price: 9.52. Major support at 8.92; near support at 9.32. Major resistance at 9.5; near resistance at 9.72. A close above 9.72 could drive the price toward 9.90–10.10; a close below 9.32 could pull toward 9.14–8.96. P20–P80 band ranges from 8.91 to 10.27, with a mid-range around 9.40. EMAs, price action relative to moving averages, and order-book dynamics contribute to the near-term directional view. Notable drivers include EMA slope, spread metrics, and BTC relative strength signals.
Drivers
- Top contributors (conceptual): return 24h, EMA slope, funding and basis Z-scores, implied order-book imbalance (EMA5), and BTC 24h return.
- Relative momentum indicators point to a modest positive tilt, while some spread and funding metrics present mixed signals. Overall, the balance favors the bulls on a 24-hour horizon, subject to price holding above 9.32.
ETF Flows (BTC/ETH)
Contextual note: ETF flows data presented here pertains only to BTC and ETH. These figures are not a primary signal for LINK, but they provide market-wide risk-on/off context that can influence liquidity and sentiment across correlated assets. The data shows:
- BTC ETF: +$14.4M on 1D, +$386.8M on 5D, +$1.02B on 10D
- ETH ETF: +$22.3M on 1D, +$102.4M on 5D, +$325.2M on 10D
What to Watch Next
- Monitor a close above 9.72 to confirm upside continuation toward 9.90–10.10.
- Stay alert for a break below 9.32, which could accelerate a move toward 9.14–8.96.
- Watch BTC/ETH ETF flow momentum as a gauge of broader risk appetite; continued inflows generally support a risk-on environment.
- Maintain awareness of volatility regime shifts; a change from Very Low could alter the expected response to price breaks.
Hashtags: #LINK #CryptoMarkets #TechnicalAnalysis #ETFFlows #BTC #ETH #MarketSnapshot #Momentum #RSI #EMA