Market Snapshot
Bitcoin and Ethereum ETF flows remain sizable in the recent period, signaling ongoing participation by institutional investors. BTC ETFs show +$14.4M on 1D, +$386.8M on 5D, and +$1.02B on 10D; ETH ETFs show +$22.3M on 1D, +$102.4M on 5D, and +$325.2M on 10D. While ETF activity provides context for risk appetite, it should not be treated as a primary signal for XRP on its own. The XRP setup relies on price action, momentum indicators, and structural levels described below.
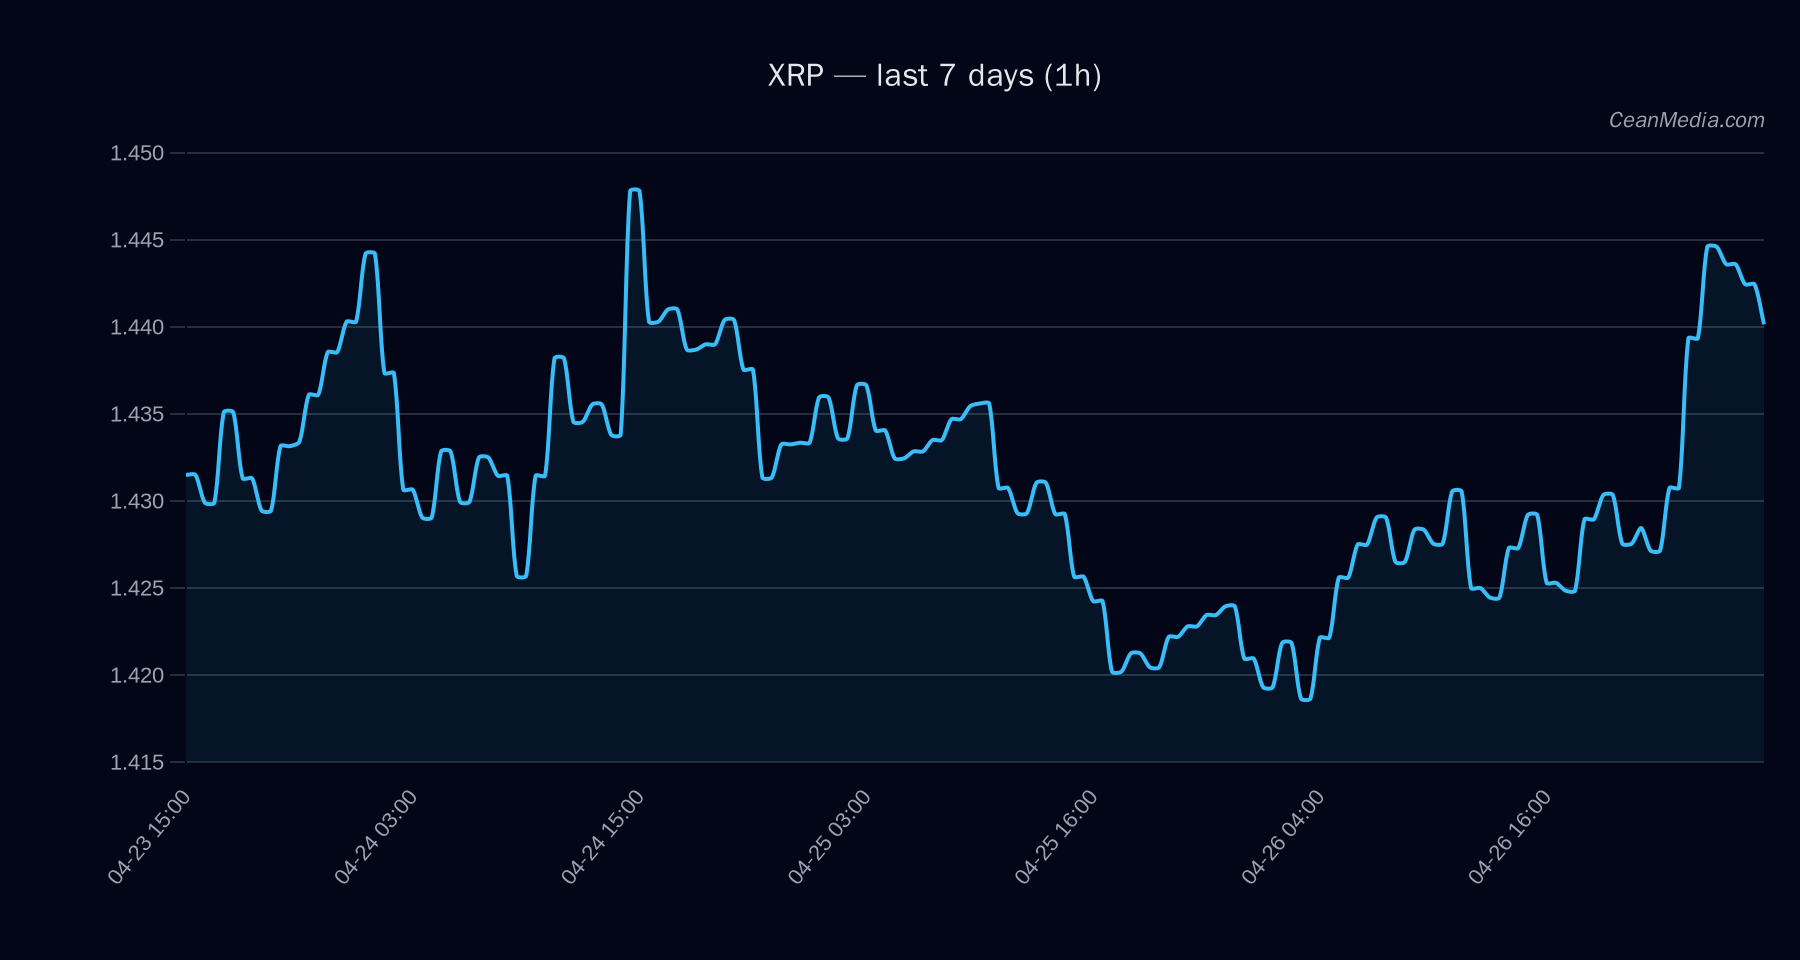
Technical Analysis: XRP
- Price today: 1.4252
- Short-Term Bias: Up (53% probability), with current stance described as sideways momentum signals (EMA12>EMA26, SMA50
- Key Levels:
- Major Support: 1.34
- Near Support: 1.40
- Major Resistance: 1.44
- Near Resistance: 1.46
- Forecast Range (next 24h):
- P20: 1.4142
- Median (P50): 1.4530
- P80: 1.5062
- Upside Trigger: 1h close > 1.46 could imply a move toward 1.4828–1.5119.
- Downside Trigger: 1h close < 1.40 could imply a move toward 1.3688–1.3408.
- Invalidation/Context: The price remains within the 1.34–1.46 range with RSI at 44 and very low volatility; a break beyond the specified triggers would reframe the path.
- Key Levels:
Drivers
- Top drivers (quantitative contributions):
- Return 24h: +0.01
- EMA slope: +0.0005
- Basis Z-score: +0.88
- OBI EMA5 (order-book imbalance): +0.09
- BTC return 24h: +0.0148
- Net sentiment and liquidity indicators show a cautious setup with very low vol regime, contributing to a sideways tilt despite the nominal upside bias.
- Other model factors include spread-related metrics and trend strength, which together present a tempered near-term trajectory rather than a strong breakout signal.
ETF Flows (BTC/ETH)
Context: ETF flow data shown here pertains to BTC and ETH only. These figures are provided for market context and should not be used as a primary signal for XRP trading decisions. The observed flows indicate continued institutional engagement and risk-on appetite, which can influence correlated assets and overall market sentiment but do not directly determine XRP price action.
: 1D +$14.4M | 5D +$386.8M | 10D +$1.02B : 1D +$22.3M | 5D +$102.4M | 10D +$325.2M
What to Watch Next
- Watch for a break above 1.46 to validate the upside range toward 1.4828–1.5119.
- Monitor 1.40 for a potential tests of near support and a possible move toward 1.3688–1.3408 on a break down.
- RSI remains neutral at 44; any sustained movement with RSI above 50 could reinforce a bullish tilt.
- Keep an eye on overall market risk sentiment as BTC/ETH ETF flows suggest ongoing risk-on participation, which may indirectly influence XRP dynamics.
Hashtags: #XRP #CryptoAnalysis #TechnicalAnalysis #ETFFlows #BTC #ETH #Market snapshot #PriceLevels #Momentum