Market Snapshot
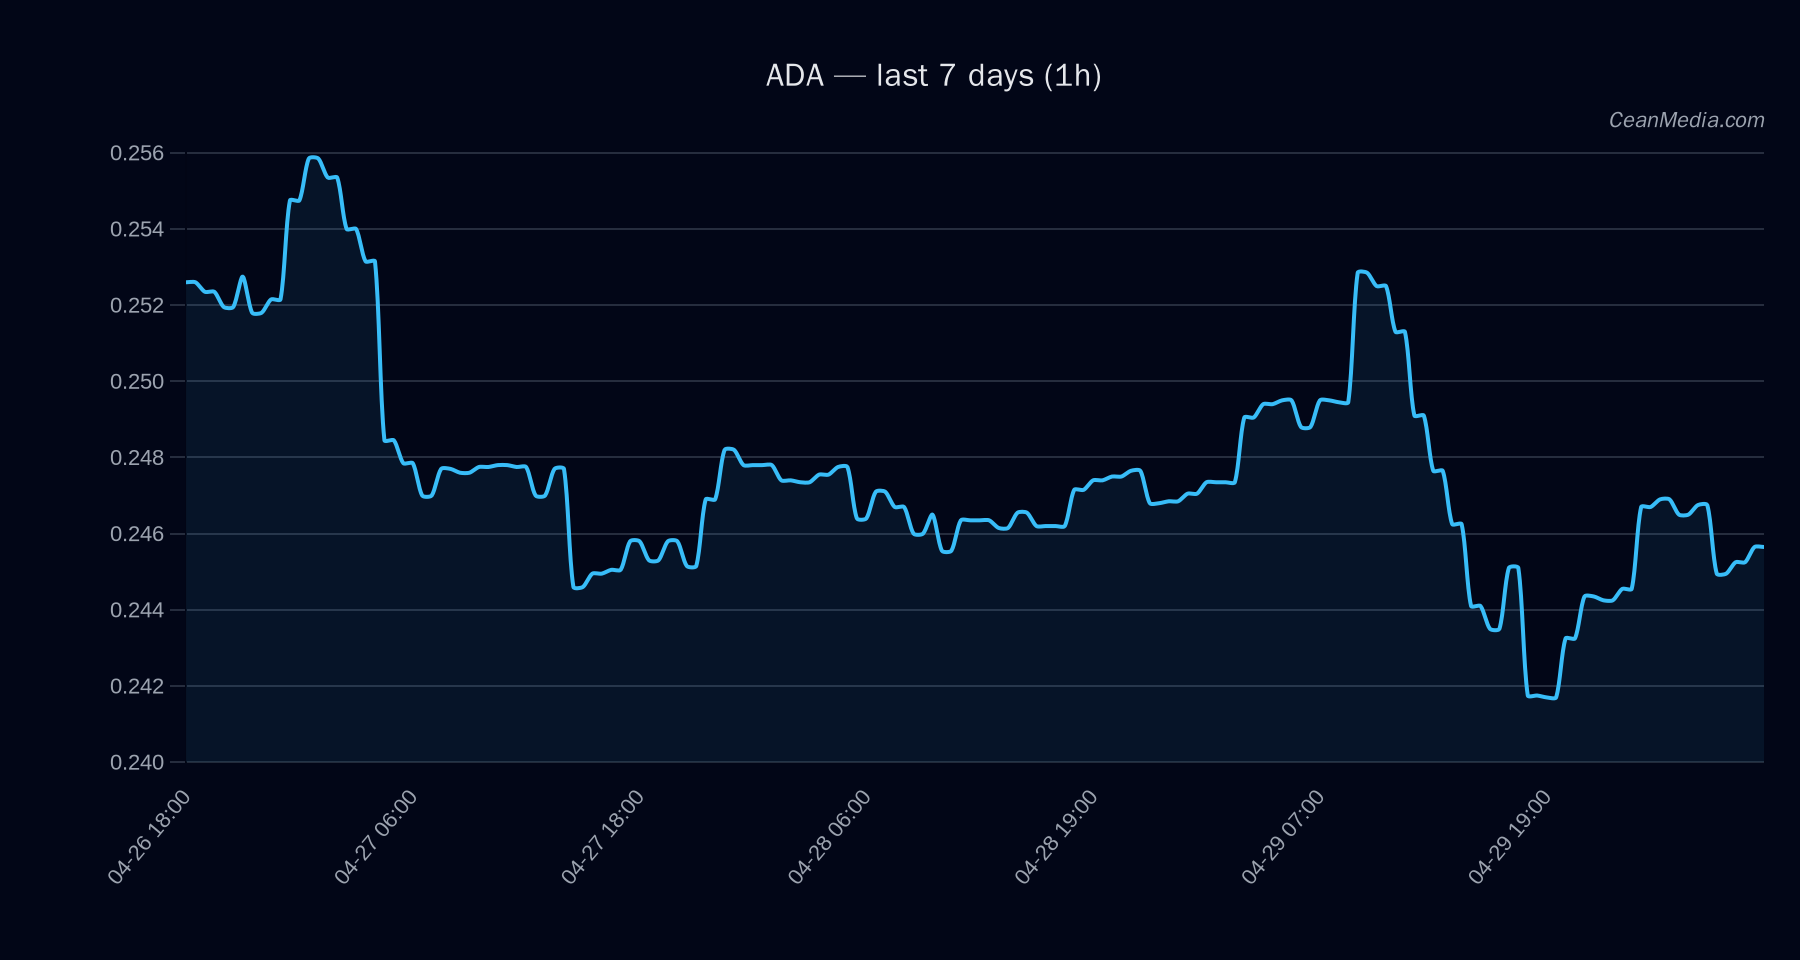
Cardano (ADA) trades around the 0.245–0.25 area, with a current price near 0.2467. The near-term bias is mildly skewed to the upside, supported by a price range between 0.2416 (P20) and 0.2573 (P80). Break above 0.25 opens a path to 0.2567–0.2617; a break below 0.24 targets 0.2369–0.2321. Market breadth remains subdued in the current window, and the volatility regime is characterized as Very Low.
Technical Analysis: ADA
- Current price: 0.2467
- Short-Term Forecast: Up (47%)
- Key levels: Support 0.245 (major), 0.24 (near); Resistance 0.255 (major), 0.25 (near)
- Breakout/Inference: Break > 0.25 → 0.2567–0.2617; Break < 0.24 → 0.2369–0.2321
- Technical observations: EMA12 < EMA26, SMA50 < SMA200; RSI 52 (neutral); Volatility (σ24h) 0.61%; Volume regime: Very Low
- Trend bias: Bullish on a break above 0.25, bearish tendencies otherwise given the EMA/SMA configuration
- Invalidation levels: A sustained close below 0.24 or above 0.255 could alter the immediate bias; monitor intraday moves for quick reaction
Drivers
- Top drivers (contributions):
- RV 7D: +1.73
- GOLD RET 5D: +1.39
- BTC DOMINANCE: −1.35 (value +1.86)
- SPREAD BP: +1.29
- STABLE MCAP LOG1P: +1.24
- LS GLOBAL Z-SCORE: +1.23
- VIX Z-SCORE: −0.86
- FNG VALUE: −0.86
- Observations: Momentum indicators show modest crosswinds, with volatility regime labeled Very Low. BTC dominance sits near 58%, contributing mixed signals for ADA via macro risk sentiment.
ETF Flows (BTC/ETH)
The ETF flow data provided reflects BTC and ETH instruments, not ADA. For context, BTC ETFs show a 1D negative flow of −$82.9M, with more extended 5D and 10D figures of −$370.8M and +$595.2M respectively; ETH ETFs indicate −$48.4M (1D), −$160.4M (5D), and +$145.8M (10D). These figures illustrate ongoing capital rotation and risk-on/off tendencies in broader crypto markets, but should not be treated as a primary signal for ADA moves. Interpret ETF data as contextual microflow signals that may influence liquidity and sentiment rather than direct ADA valuation drivers.
What to Watch Next
- Watch for a daily close above 0.25 to validate near-term bullish continuation toward 0.2567–0.2617.
- Monitor a sustained move below 0.24 for potential acceleration toward 0.2369–0.2321.
- Keep an eye on BTC dominance and overall market risk appetite, as shifts can modulate ADA volatility even if ADA’s own technicals remain neutral to bullish.
- Track ETF flows in BTC/ETH as contextual risk signals that may influence market sentiment and liquidity, rather than as a direct ADA signal.
Hashtags: #ADA #Cardano #CryptoAnalysis #TechnicalAnalysis #ETFFlows #BTC #ETH #MarketSentiment #CryptoMarkets #TradingIdea #PriceAction
Conclusion
In the current setup, ADA exhibits a balanced near-term outlook with a defined resistance at 0.255 and support at 0.245–0.24. The primary triggers remain a close above 0.25 for upside extension or a break below 0.24 for downside risk. ETF flow context provides macro-level sentiment read rather than actionable ADA signals.