Market Snapshot
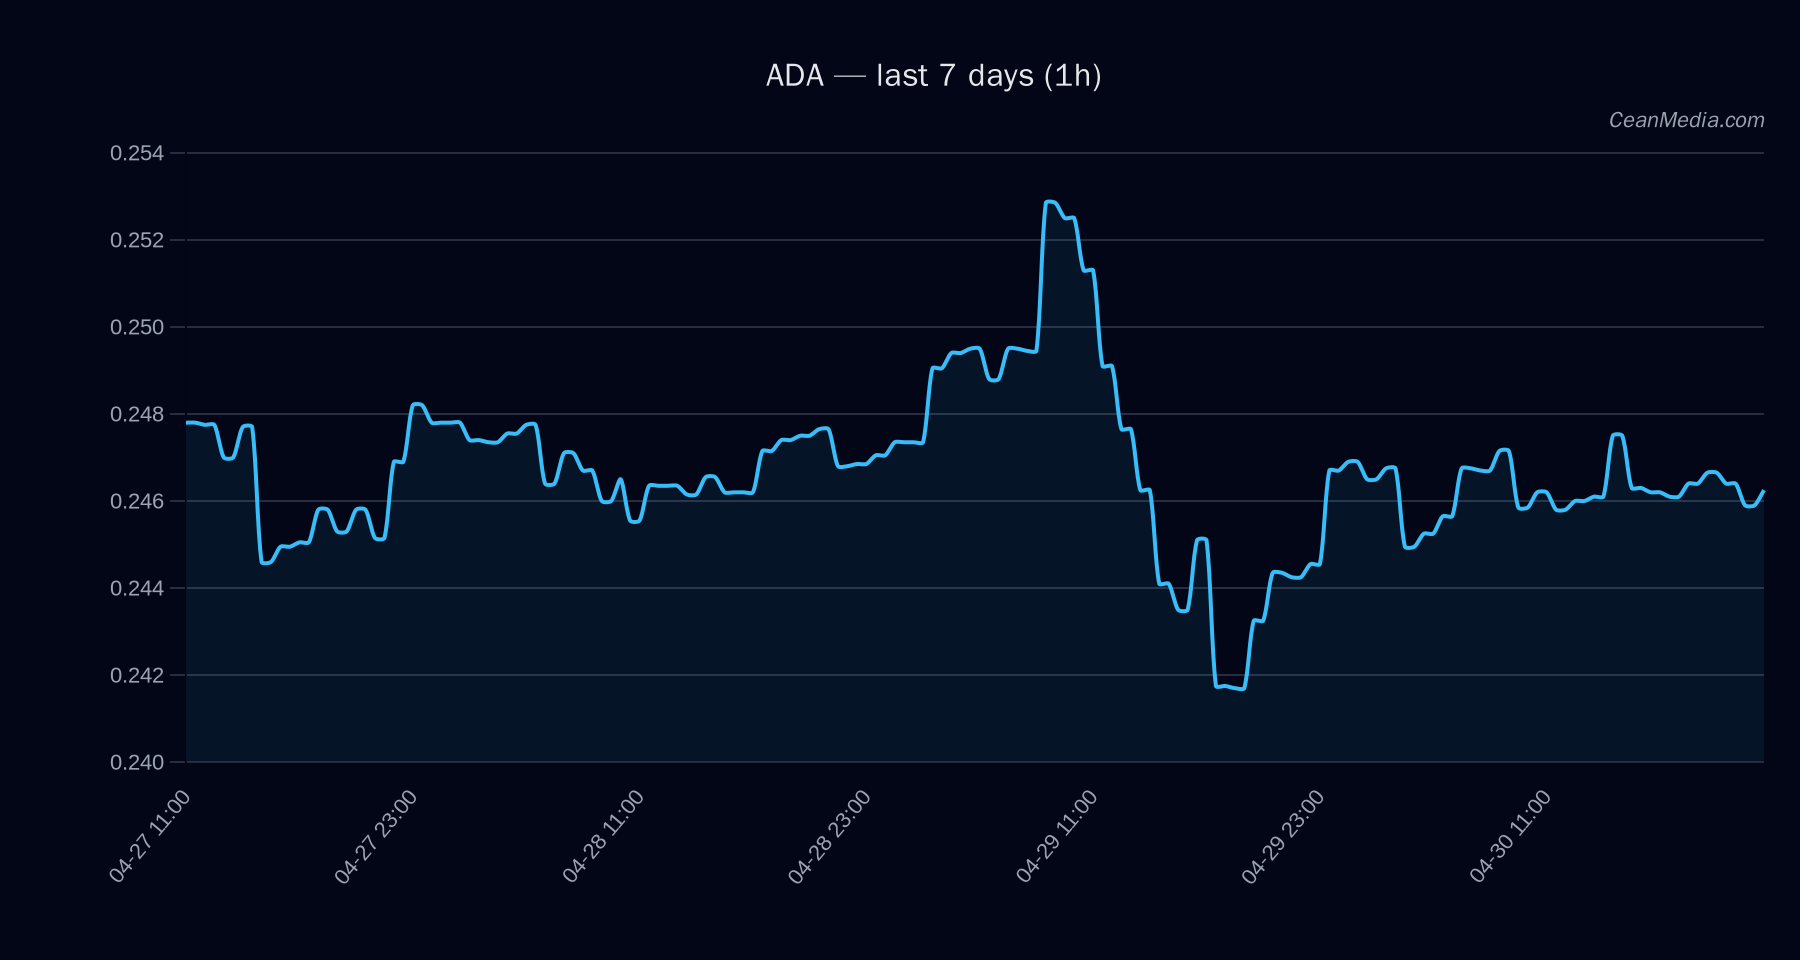
Cardano (ADA) is trading around the 0.246 area, with near-term volatility subdued. The latest model metrics show a narrow price band between the 0.245 support and 0.255 resistance, and a sideways forecast with modest probabilities assigned to upside and downside moves. Market breadth remains weak, and volatility regime is described as very low.
- Price: 0.2466
- Short-Term Forecast: sideways (6%)
- Probabilities: Up 48%, Side 6%, Down 46%
- Key indicators: EMA12>EMA26, SMA50
- Volatility: σ24h 0.33%, Vol regime: Very low
Technical Analysis: ADA
Bias and Range: ADA sits between major support at 0.245 and major resistance at 0.255. A break above 0.25 targets 0.2566–0.2616; a break below 0.24 targets 0.2368–0.232. The P20–P80 band spans 0.2425–0.2579, indicating a relatively tight trading range in the near term.
Key Levels:
- Near Support: 0.24; Major Support: 0.245
- Near Resistance: 0.25; Major Resistance: 0.255
- Upside trigger: 1h close > 0.25 → 0.2566–0.2616
- Downside trigger: 1h close < 0.24 → 0.2368–0.232
Indicators: EMA12>EMA26, RSI 52, SMA50 Invalidation/Watchpoints: ETF flow data provided here is limited to BTC and ETH instruments. This context is auxiliary and should not be treated as a primary signal for ADA. In the current window: Interpretation: The net flows show a mixed but generally modest outflow over the short term for BTC with some longer-term inflows visible, while ETH experiences a similar pattern. This context can reflect risk-on/off sentiment and macro liquidity considerations but should not be used in isolation to drive ADA trading decisions. Hashtags: #ADA #Cardano #CryptoAnalysis #TechnicalAnalysis #MarketSnapshot #ETFFlows #BTC #ETH #CryptoMarkets #RiskOn #RiskOff #MarketForecast
Drivers
ETF Flows (BTC/ETH)
What to Watch Next