Market Snapshot
BNB is trading around the mid-600s, with a price of 616.5 and a near-term bias still leaning bearish. The brief technical backdrop indicates a down forecast probability of 53% against a 30% up scenario, with the balance represented by sideways probability. The current setup shows EMA12 below EMA26, SMA50 below SMA200, RSI at 47, and a very low 24-hour volatility regime. The price remains confined between a near-term support of 604 and a resistance around 629, with a major level at 617 acting as a potential anchor for intraday action.
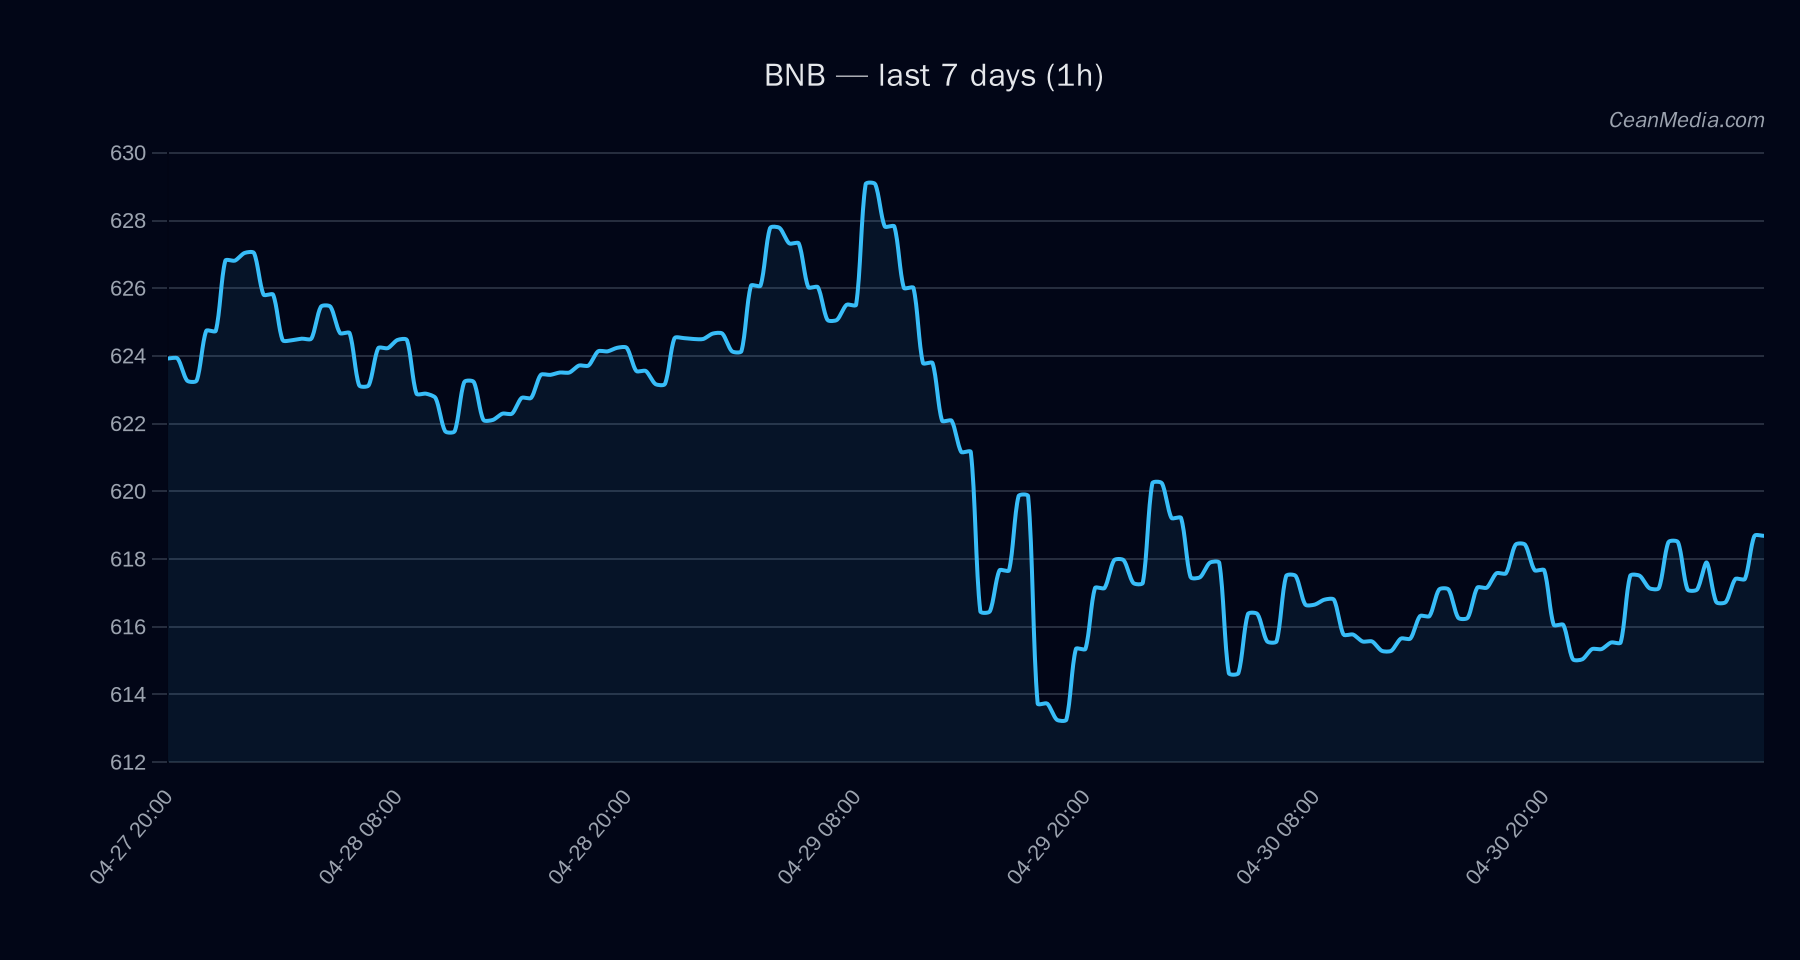
- Price: 616.5
- Short-Term Forecast: Down (53%)
- Support: 604 (Near: 604, Major: 617)
- Resistance: 629 (Near: 629, Major: 640)
- Recent Band (P20–P80): 599.96 – 626.64
- Volatility Regime: Very low
Technical Analysis: BNB
- Bias: Bearish in the near term due to EMA cross, RSI softness, and subdued volatility.
- Key Levels:
- Support: 604 (Near); Major: 617
- Resistance: 629 (Near); Major: 640
- Breakout / Invalidation Triggers:
- Break > 629: potential move toward 641.41 – 653.98
- Break < 604: potential decline toward 592.09 – 580.00
- Indicators:
- EMA12 < EMA26; SMA50 < SMA200
- RSI 47
- Volatility: Very low
Drivers
: - LIQ IMB EMA12: +4.08 (value 7.32)
- RV 24H: -1.57 (value -1.4)
- NASDAQ100 RET 5D: -1.32 (value 0.5)
- DEPTH USD 10BP LOG1P: +1.3 (value 1.65)
- SP500 RET 5D: +1.27 (value 0.4)
- BTC RV 24H: +1.14 (value -0.53)
- STABLE MCAP LOG1P: -1 (value 1.22)
- BASIS Z-SCORE: -1 (value -5.67)
- Momentum/Volatility context: Breadth >50h at 83%, BTC-RSN 72h correlation high at 0.85, very low vol regime, Fear index at 26. BTC.D around 58.3% with a slight uptick; 7d BTC dominance signal supportive of risk-off tone.
ETF Flows (BTC/ETH)
Note: ETF data in this section pertains to BTC and ETH only. This context is not a primary signal for BNB but provides broader market flow dynamics that can influence risk sentiment and cross-asset correlations.
: +$4.4M (1D); 5D: -$417.0M; 10D: +$590.2M : -$3.4M (1D); 5D: -$99.7M; 10D: +$113.1M
Interpreting flows: Overall BTC ETF activity shows a near-term positive momentum signal, while ETH flows are modestly negative on 1D but positive over the 10D window. These patterns suggest a mixed risk-on/off environment, with BTC flows providing a somewhat supportive backdrop for broader crypto market participation, albeit not specifically directional for BNB. Investors should treat ETF data as ancillary context rather than a primary driver for BNB trajectory.
What to Watch Next
- Monitor a daily close above 629 to target 641.41–653.98.
- Watch 604 as a critical intraday/psychological floor; a break below could accelerate decline toward 592–580.
- Observe volatility regime shift from very low to higher levels, which could precede a change in trend dynamics.
- Keep an eye on BTC dominance and ETF flow momentum as supplementary context for risk appetite shifts.
Hashtags: #BNB #CryptoAnalysis #TechnicalAnalysis #ETFFlows #Bitcoin #Altcoins #MarketSnapshot #RiskManagement #TradingStrategy #CryptoNews #Blockchain