Market Snapshot
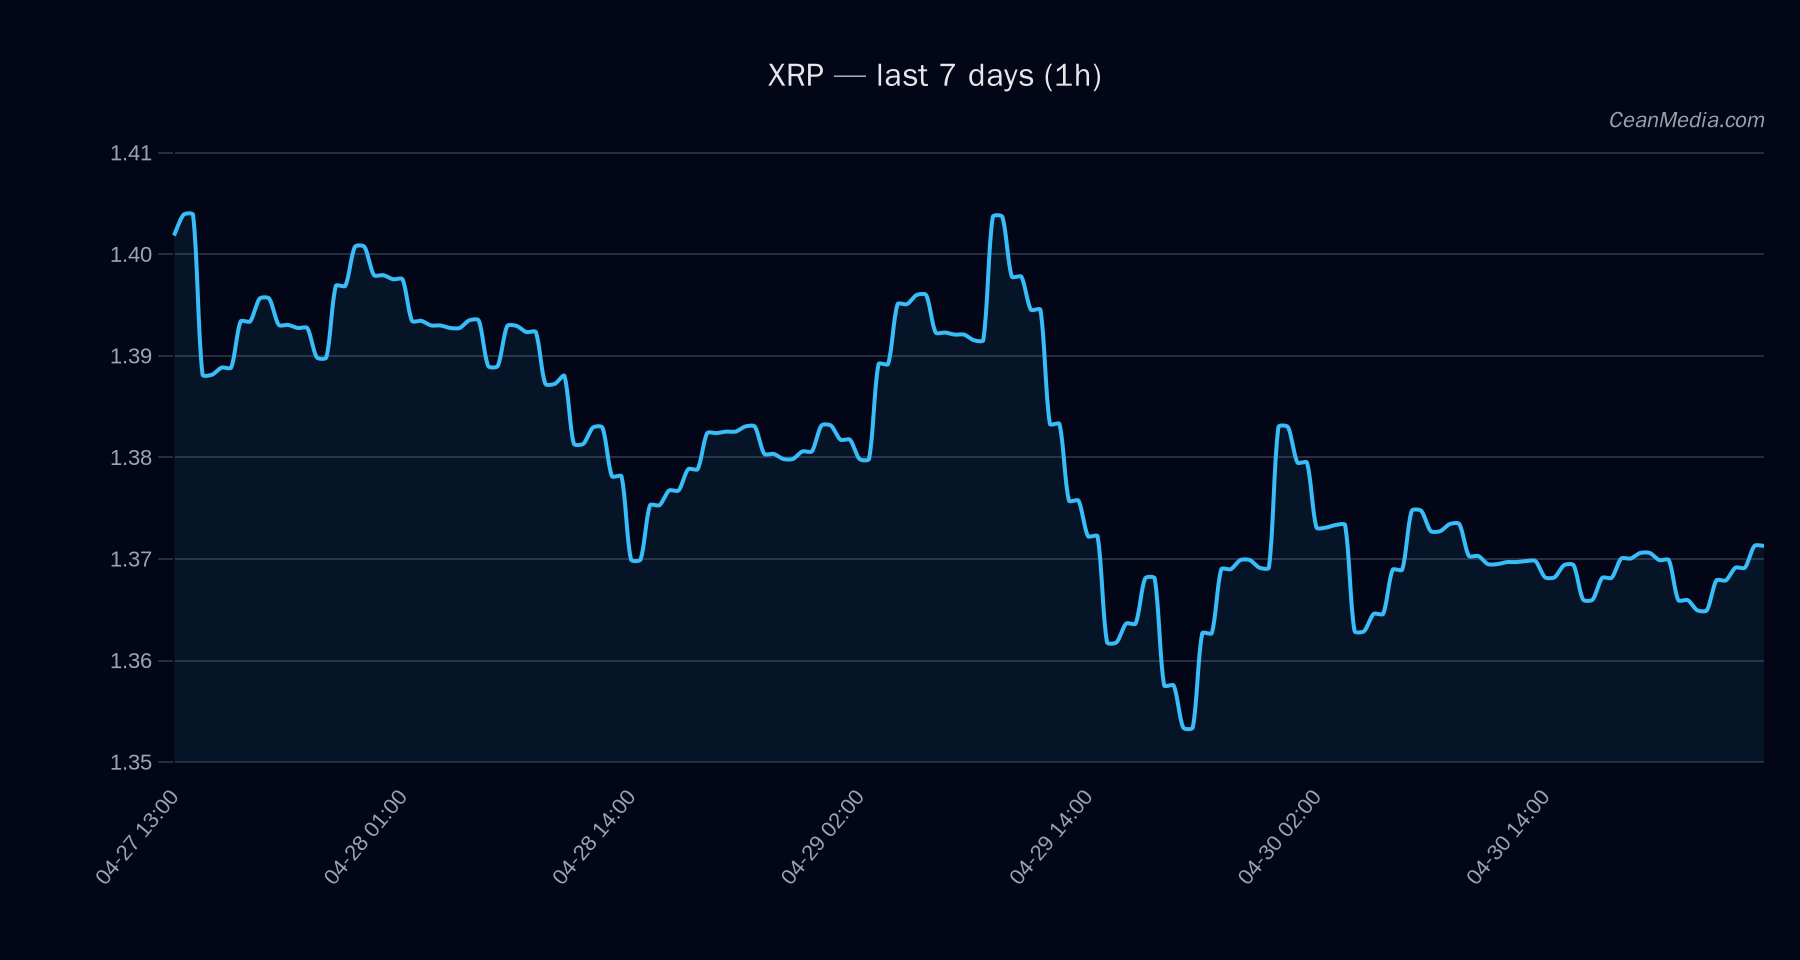
On 2026-05-01, XRP trades near 1.37 with a short-term bias leaning up. The immediate range is framed by a major support at 1.36 and a major resistance at 1.44, with near-term levels at 1.34 (support) and 1.40 (resistance). The overnight volatility regime is described as very low, and RSI sits around neutral at 51, suggesting modest upside pressure absent breakout momentum. The breadth context shows a neutral to cautious tone, with BTC showing a 72-hour correlation of 0.89 to XRP and overall market breadth around 50% in recent periods.
Technical Analysis: XRP
- Price: 1.3708 (close around 1.3713 in forecast data)
- Short-Term Forecast: Up, with a probability of ~42.6% as per the model;
- Key Levels:
- Major Support: 1.36
- Near Support: 1.34
- Major Resistance: 1.44
- Near Resistance: 1.40
- Break Triggers:
- Upside Break (>1.40) could imply a move toward 1.4262–1.4541
- Downside Break (<1.34) could imply a move toward 1.3165–1.2896
- Momentum Indicators: EMA12 < EMA26, SMA50 < SMA200 (bearish configuration); RSI ~51 (neutral); Volatility regime: Very low
- Implied Bias: Neutral to mildly bullish in the near term; only a break of key levels would shift the trajectory.
- Drivers (Top Signals): RV 7D positive signal with modest contribution; Vol-of-Vol negative; Depth USD 10bp log1p negative; ETF-related flows not directly used for XRP by design
Drivers
-
- RETURN 24H: -0.0059
- EMA SLOPE: +0.00032
- FUNDING Z-SCORE: -0.516
- BASIS Z-SCORE: -0.676
- ORDER-BOOK IMBALANCE (EMA5): +0.109
- BTC RETURN 24H: +0.00592
- Overall Momentum: The forecast embeds an up bias with a relatively narrow probability band; volatility remains very low, indicating limited intraday swings unless a breakout occurs.
- Volatility & Regime: Very low; VIX delta and vol-of-vol indicators are negative to neutral, suggesting a risk-off-leaning but not decisively crowded in one direction.
ETF Flows (BTC/ETH)
The reported ETF flow data provided is specific to BTC and ETH and is presented here for contextual market sentiment rather than as a primary signal for XRP. USD flows show:
- BTC ETF: 1D at -$82.9M; 5D at -$370.8M; 10D at +$595.2M
- ETH ETF: 1D at -$48.4M; 5D at -$160.4M; 10D at +$145.8M
Interpretation: The BTC/ETH ETF flows reflect a nuanced risk-on/off backdrop in the broader crypto market. The collective appetite appears to be mixed, with shorter-term outflows in BTC/ETH suggesting caution, while the longer horizon shows inflows in BTC. It is important to emphasize that XRP is not directly signalized by these ETF figures; they serve as a contextual barometer for macro risk sentiment and liquidity dynamics that can influence all spot crypto assets, including XRP.
What to Watch Next
- Watch for a sustained close above 1.40 to validate the upside channel toward 1.4262–1.4541.
- A break below 1.34 would shift the near-term bias toward 1.3165–1.2896, increasing downside risk.
- Monitor BTC/ETH ETF flow shifts in the next sessions as a sentiment backdrop; look for corroboration with XRP price action on increasing liquidity or volatility regimes.
- Keep an eye on RSI and EMA relationships for any divergence signaling a change in momentum.
Hashtags: # XRP # cryptoanalysis # XRPUSDT # technicalanalysis # marketnews # ETFflows # BTC # ETH # riskon # riskoff # liquidity