Market Snapshot
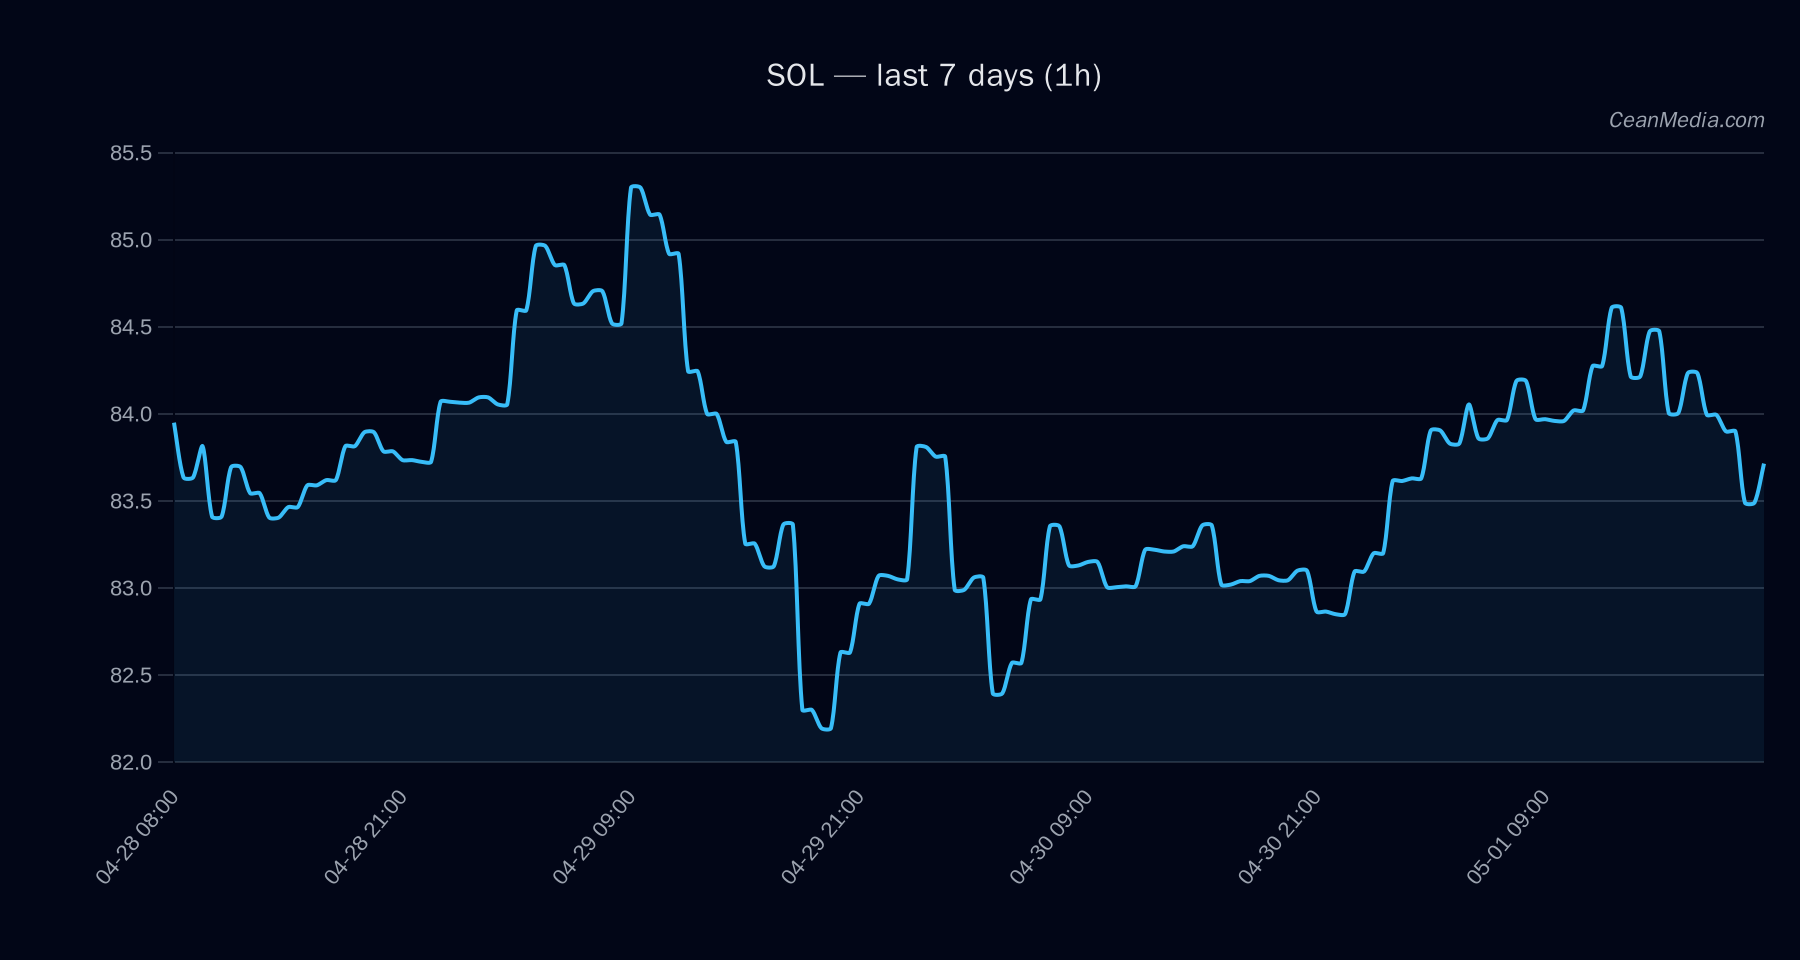
SOL trades near the 82.1–85.4 range, with the immediate view biased toward sideways action. The current price sits at approximately 83.7, flat on the day, as breadth remains positive but volatility remains very low.
Technical Analysis: SOL
- Current setup: EMA12 > EMA26, SMA50 < SMA200, RSI around 49, 24h volatility (σ24h) ~0.29%, volume regime: very low.
- Support / Resistance: Major support at 83.5, near-term support at 82.1. Major resistance at 87.8, near-term resistance at 85.4.
- Forecast and bias: Forecast is sideways (7% range). Probability: Up 47.8%, Sideways 7.1%, Down 45.1% (approximate from raw data). Band prestige: P20–P80 between 82.14 and 83.50. 1h upside trigger: close > 85.4 could target 87.12–88.83. 1h downside trigger: close < 82.1 could target 80.42–78.78.
- Levels to watch: Break above 85.4 signals potential move toward 87.1–88.8. Break below 82.1 increases risk toward 80.4–78.8.
- Momentum indicators: RSI ~49 indicates neutral momentum. Volatility regime is very low, suggesting a subdued intraday range ahead.
- Invalidation: Breakdown below 82.1 or breakout above 87.8 would reframe the near-term bias toward the respective targets above.
Drivers
- Top drivers show mixed contributions: NASDAQ100 RET 5D positive, DOW RET 1D positive, while RUSSELL2000 RET 1D and RV 24H are negative.
- Fundamentals: FUNDING Z-SCORE and BASIS Z-SCORE are modestly positive, indicating some carry in the funding and price baselines setup.
- Order-book balance and trend strength metrics are near neutral to modestly positive, suggesting limited near-term directional pressure.
- BTC-related signals: BTC 24h return is positive and BTC dominance sits around 58.4%, with overall market breadth supporting risk-on sentiment in broad indices but not strongly spilling into SOL on its own.
ETF Flows (BTC/ETH)
ETF flow context is provided for BTC and ETH only. BTC ETFs show a +$4.4M 1D inflow, with 5D and 10D flows in different directions, ETH ETFs show a -$3.4M 1D flow with mixed longer-term flows. Note that these ETF data points are context for market sentiment and risk appetite, not primary signals for SOL price action.
What to Watch Next
- Watch for a close above 85.4 to validate a potential test of 87.8–88.8 resistance zone.
- Monitor 82.1 as a near-term support; a break below could accelerate a move toward 80.4–78.8.
- Track BTC strength and overall breadth, as these influence risk-on/risk-off sentiment and may impact SOL correlations.
- Observe volatility regime shifts; a move from very low to higher volatility could precede a breakout or breakdown.
Hashtags: #Solana #SOLAnalysis #CryptoTechnicals #MarketSnapshot #ETFFlows #BTC #ETH #CryptoMarkets #RiskOn #PriceAction #TradingLevels #MarketForecast