Market Snapshot
BNB closes near mid-range with a current price around 615.64. Market breadth remains modestly positive but overall volatility is very low. BTC-dominance trend shows a slight uptick over the past week, adding a cross-market risk-on tilt. ETF flows in BTC and ETH indicate ongoing appetite for exchange-traded exposure in major crypto assets, though these signals should be viewed as contextual rather than primary drivers for BNB pricing.
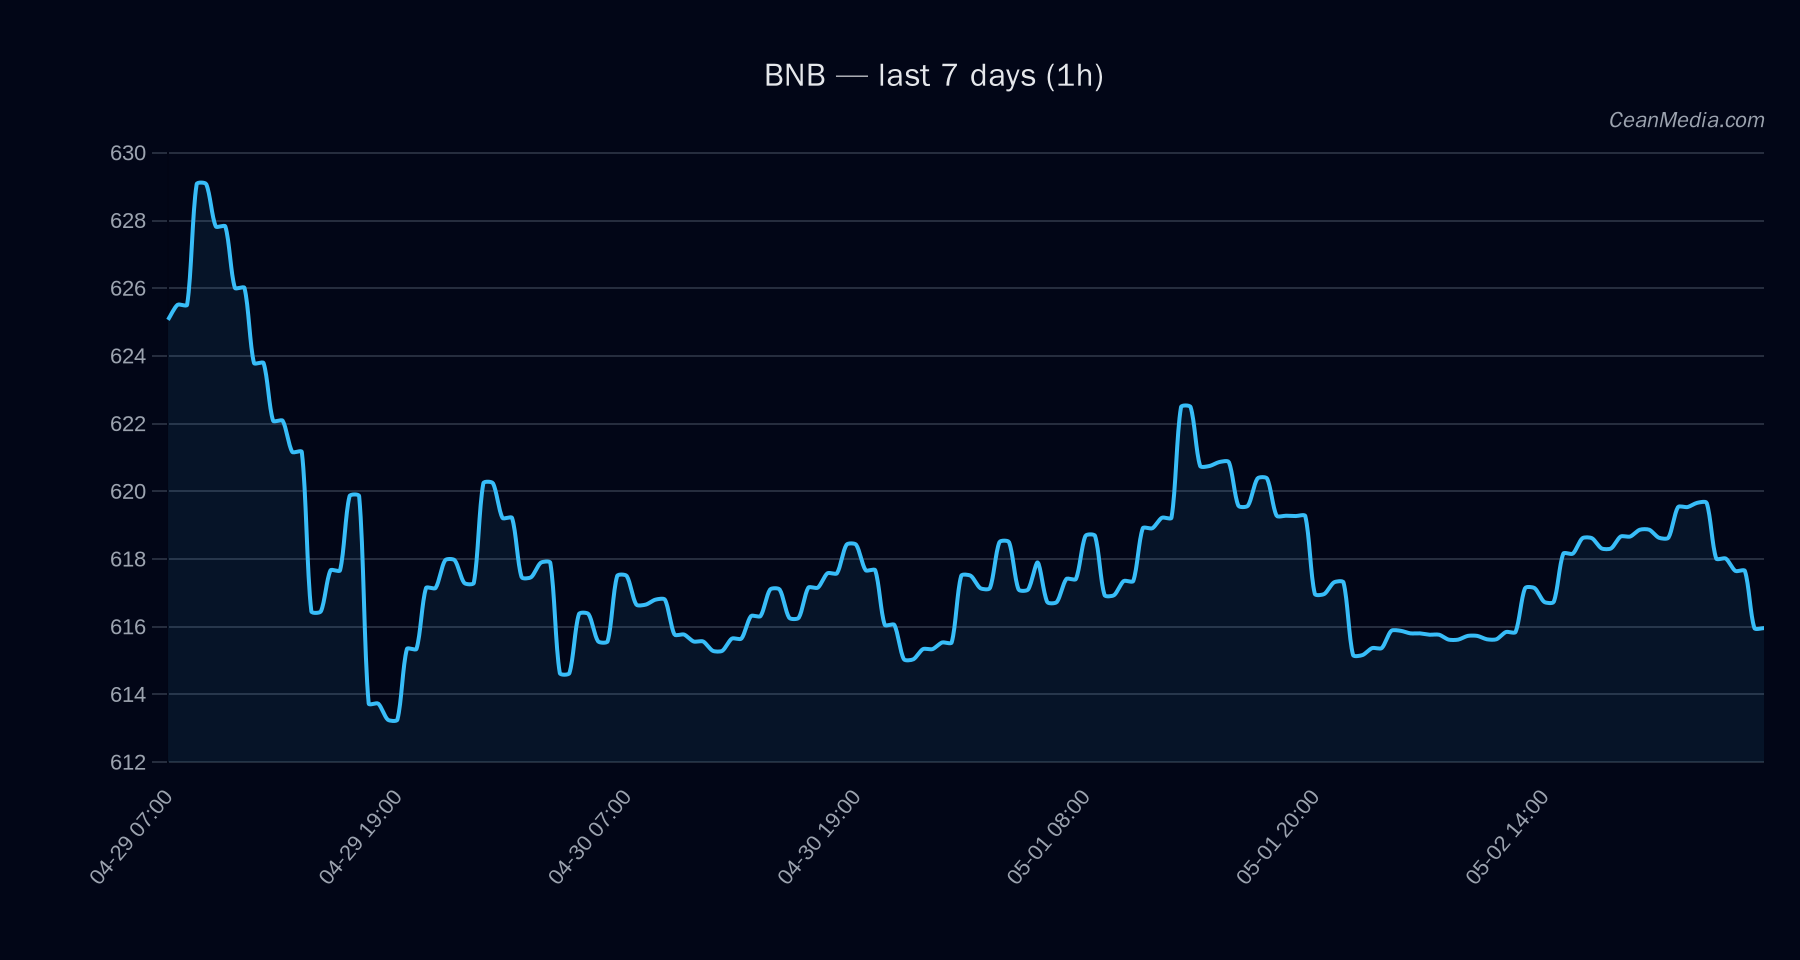
Technical Analysis: BNB
- mixed/neutral with low certainty (10/100).
- -0.7; conflicts: 0.
- Close at 615.64.
- sideways; RSI 39.
- EMA12>EMA26, SMA50
- P50 604.9988; P20-P80 598.5667 – 635.2106.
- Support near 603; Major support 603, Resistance near 628; Major resistance 640.
- Up: 1h close > 628 -> 640.5119 / 653.0709. Down: 1h close < 603 -> 591.2607 / 579.1941.
- Breakouts require sustained closes beyond trigger levels and a confirmatory candle pattern or volume surge beyond the current very low regime.
Drivers
- LIQ IMB EMA12 (contrib 2.82), DEPTH USD 10BP LOG1P (2.42), RV 24H (-1.66), BTC RV 24H (1.34), STABLE MCAP LOG1P (-1.29), DEPTH Z-SCORE (-0.99).
- Vol regime is very low; BTC dominance trend is modestly positive over 7 days; breadth is 33% above SMA50 (limited breadth strength).
- Read indicates price hovering between key levels with no clear breakout momentum. RSI at 39 suggests potential for further downside pressure if sold into.
ETF Flows (BTC/ETH)
Context on ETF flows provided for BTC and ETH only. BTC ETF: 1D +$629.8M, 5D +$198.4M, 10D +$585.2M. ETH ETF: 1D +$101.2M, 5D -$20.8M, 10D +$81.6M. These flows reflect broader market appetite for cryptocurrency exposure but are not a primary signal for BNB price action. They should be interpreted as supportive background liquidity and risk sentiment signals rather than direct drivers for BNB.
What to Watch Next
- Watch for a clear close above 628 to confirm upside continuation toward 640/653 targets.
- Monitor if price breaks below 603 with renewed volume to validate potential downside toward 591/579 levels.
- Observe changes in BTC/ETH ETF flow momentum as a context for cross-market risk appetite.
- Keep an eye on volatility regime; a shift from very low could precede more pronounced price moves.
Hashtags: #BNBAnalysis #CryptoMarkets #TechnicalAnalysis #ETFFlows #BTCETF #ETHETF #MarketSnapshot #PriceAction #RiskOn #CryptoLiquidity #AltSeasonContext #MarketContext