Market Snapshot
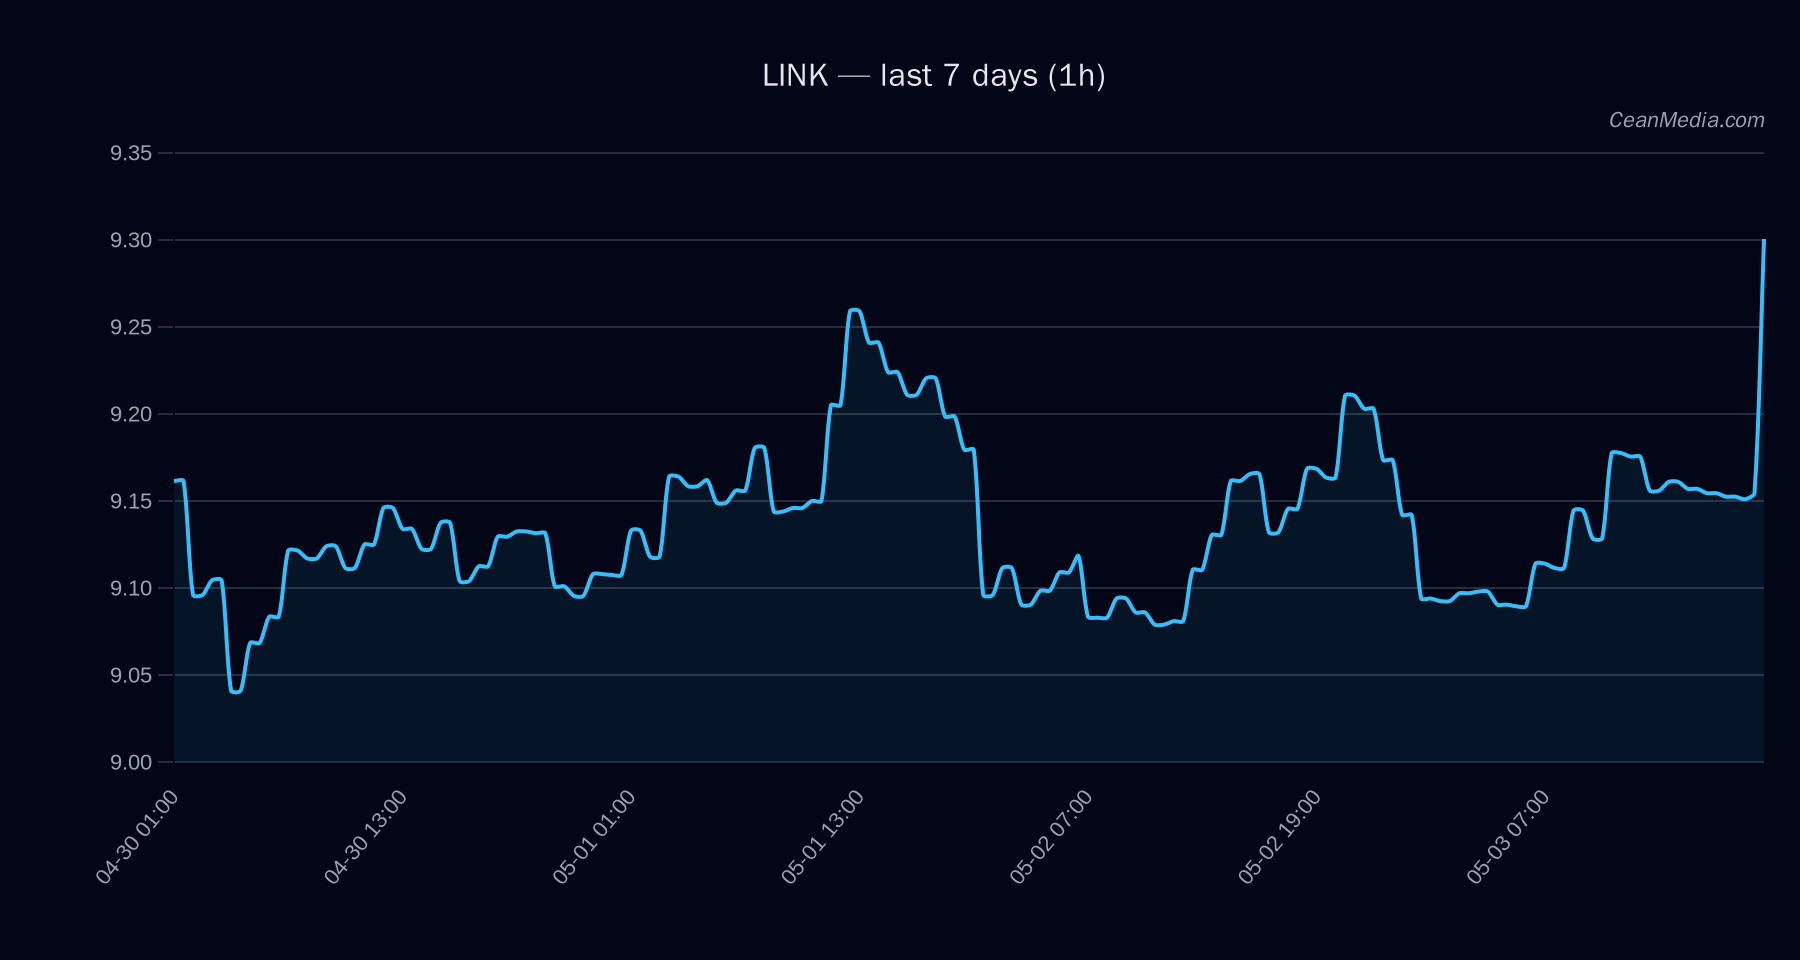
As of 2026-05-04, Chainlink (LINK) trades around the 9.3 level amid a mixed technical outlook. The model signals a down bias with sideways TA characteristics in the near term, while macro/market context shows very low volatility and a broadly constructive environment for risk assets. ETF flows provided are for BTC and ETH and should be treated as contextual signals rather than primary drivers for LINK price action.
Technical Analysis: LINK
- Price: Close 9.3
- Market Bias: mixed / neutral; certainty low (5/100)
- Composite score: -0.7; conflicts 2
- Trend: TA trend sideways; RSI 75
- Key indicators: EMA12>EMA26, SMA50
- Forecast: Model indicates a down tilt (50%), with 39% up and 10% sideways
- Forecast range (P50): 9.1921; P20-P80: 8.6391 – 10.0
- Major levels: Support near 9.12 (major 9.12); Resistance near 9.48 (major 9.5)
- Triggers: Up: close > 9.48 targets 9.6757–9.8654; Down: close < 9.12 targets 8.9317–8.7494
- Invalidation / Caveats: Evidence is not aligned; expect trigger confirmation before high-conviction directional bets.
Drivers
- SPREAD BP, FNG VALUE, LS GLOBAL Z-SCORE, LS TOP Z-SCORE, BTC TREND STRENGTH, RV 24H
- Momentum/Volatility: Very low vol regime; RSI in overbought territory at 75, signaling potential near-term pullback risk despite breadth strength (100% above SMA50).
Cross-market risk assets supportive; Fear index around 40; BTC dominance around 58.5% with a modest 7-day uptick
ETF Flows (BTC/ETH)
ETF flow data shown here pertains exclusively to BTC and ETH. While it provides sentiment about broader market participation, it is not a primary signal for LINK and should be interpreted as contextual risk-on/risk-off pressure for the crypto ecosystem.
- BTC ETF: +$629.8M (1D); +$198.4M (5D); +$585.2M (10D)
- ETH ETF: +$101.2M (1D); -$20.8M (5D); +$81.6M (10D)
What to Watch Next
- Watch for a close above 9.48 to validate a potential move toward 9.6757–9.8654 in the short run.
- Monitor for a break below 9.12 which would expose the 8.93–8.75 zone.
- Observe any shifts in ETF flows for BTC/ETH as a secondary risk signal, noting this data is contextual rather than primary for LINK.
- Keep an eye on RSI behavior and volatility regime, as a move away from very low volatility could precede a breakout or breakdown.
Hashtags: #crypto # LINK #LINKanalysis #BTC #ETH #ETFFlows #marketview #technicalanalysis #trading #riskmanagement #cryptomarket
Note: ETF data is provided for BTC and ETH only and should not be used as the sole basis for LINK trading decisions. It serves as contextual backdrop to the broader market environment.