Market Snapshot
Date: 2026-05-05 | Primary Asset: BNB | Close: 624.81. Market context shows very low volatility for the session with breadth clearly positive above the 50-day average. BTC dominance is elevated (58.7%), and cross-market risk assets are supportive in the near term. ETF flow context is provided for BTC and ETH as part of broader market signals, but should not be treated as a primary driver for BNB trading decisions.
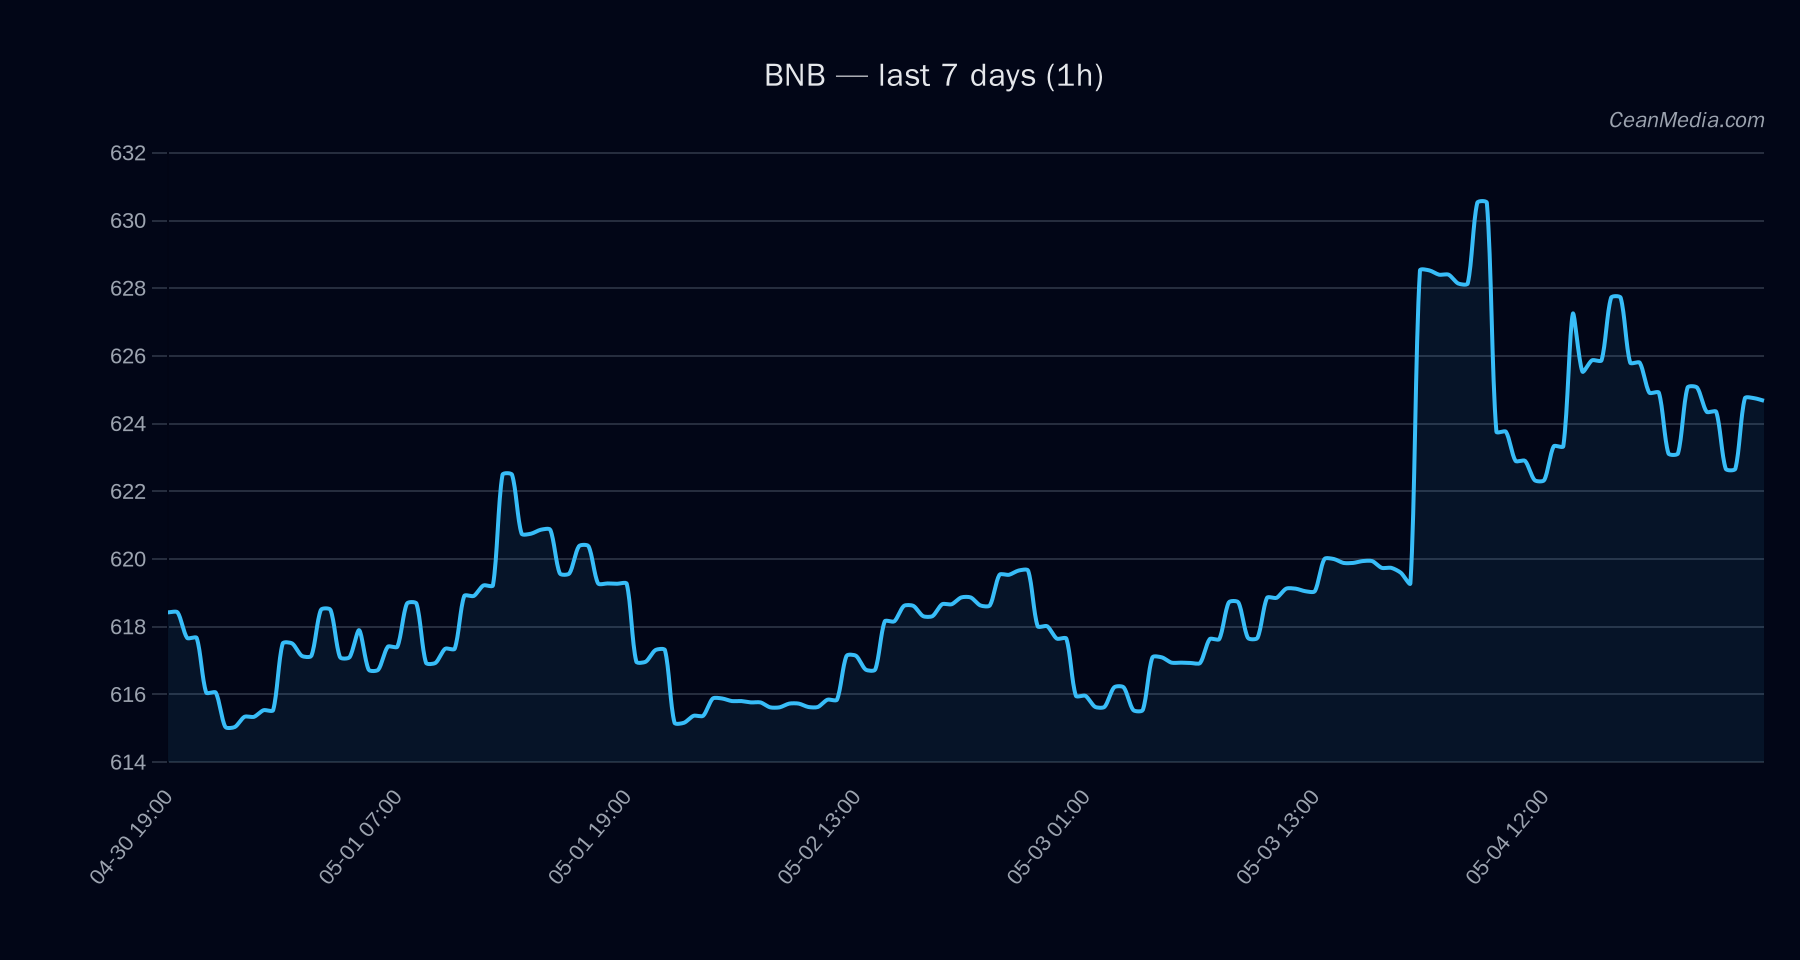
Technical Analysis: BNB
- Mixed/Neutral with low certainty (5/100). Composite score -0.3; conflicts 1. Data quality indicates some misalignment; traders should wait for confirmation before treating direction as high-conviction.
-
- Close: 624.81
- Support: near 612; Major support at 617
- Resistance: near 637; Major resistance at 639
- Forecast range (P20–P80): 593.81 – 632.61; P50: 624.95
- Sideways, RSI 53. EMA12 > EMA26; SMA50 < SMA200; Volatility regime: Very low; 24h σ about 0.44%.
-
- Up: 1h close > 637 → 650.05 – 662.80
- Down: 1h close < 612 → 600.07 – 587.82
- Model forecast indicates Up 53%, Side 18%, Down 29%; Read shows BTC/Alt breadth robust but with neutral RSI posture for BNB.
- If price breaks decisively below 612 with sustained momentum, consider downside targets per the down triggers.
Drivers
-
- SPREAD BP: Negative contribution (-1.52)
- RV 7D: Negative contribution (-1.47)
- GOLD RET 5D: Negative contribution (-0.33)
- BTC DOMINANCE: Positive contribution (3.03)
- BREAKOUT 7D: Positive contribution (0.78)
- FNG VALUE: Positive contribution (40)
- Breadth above SMA50 at 100%; BTC correlation to equities strong (ρ(BTC,72h) ~ 0.86). Vol regime is Very low, suggesting a lack of short-term breakout activity.
- Taker flow indicates selling pressure (-58.1%), with positioning skewed toward long crowdedness (1.65x). Momentum indicators reflect a cautious stance despite the neutral trend.
ETF Flows (BTC/ETH)
Context: ETF flow data below pertains to BTC and ETH. This information is relevant for sentiment and macro risk appetite but is not a primary signal for BNB. BTC and ETH ETF flows can reflect broader risk-on or risk-off dynamics in correlated assets; traders should not rely on ETF signals as a sole driver for BNB decisions.
- 1D +$629.8M; 5D +$198.4M; 10D +$585.2M
- 1D +$101.2M; 5D -$20.8M; 10D +$81.6M
What to Watch Next
- Monitor for a close above 637 to validate potential upside extension toward 650–663.
- Watch for a break below 612 to confirm downside risk toward 600–588 levels.
- Keep an eye on BTC dominance and overall market breadth, as continued risk-on signals may support consolidation above key levels.
- Monitor ETF flow momentum as a contextual gauge of cross-asset risk appetite, while maintaining focus on BNB-specific technicals.
Hashtags: #BNB #Binance #CryptoAnalysis #TechnicalAnalysis #ETFFlows #CryptoMarkets #MarketSnapshot #TradingStrategy #Momentum #RiskManagement #CryptoNews