Market Snapshot
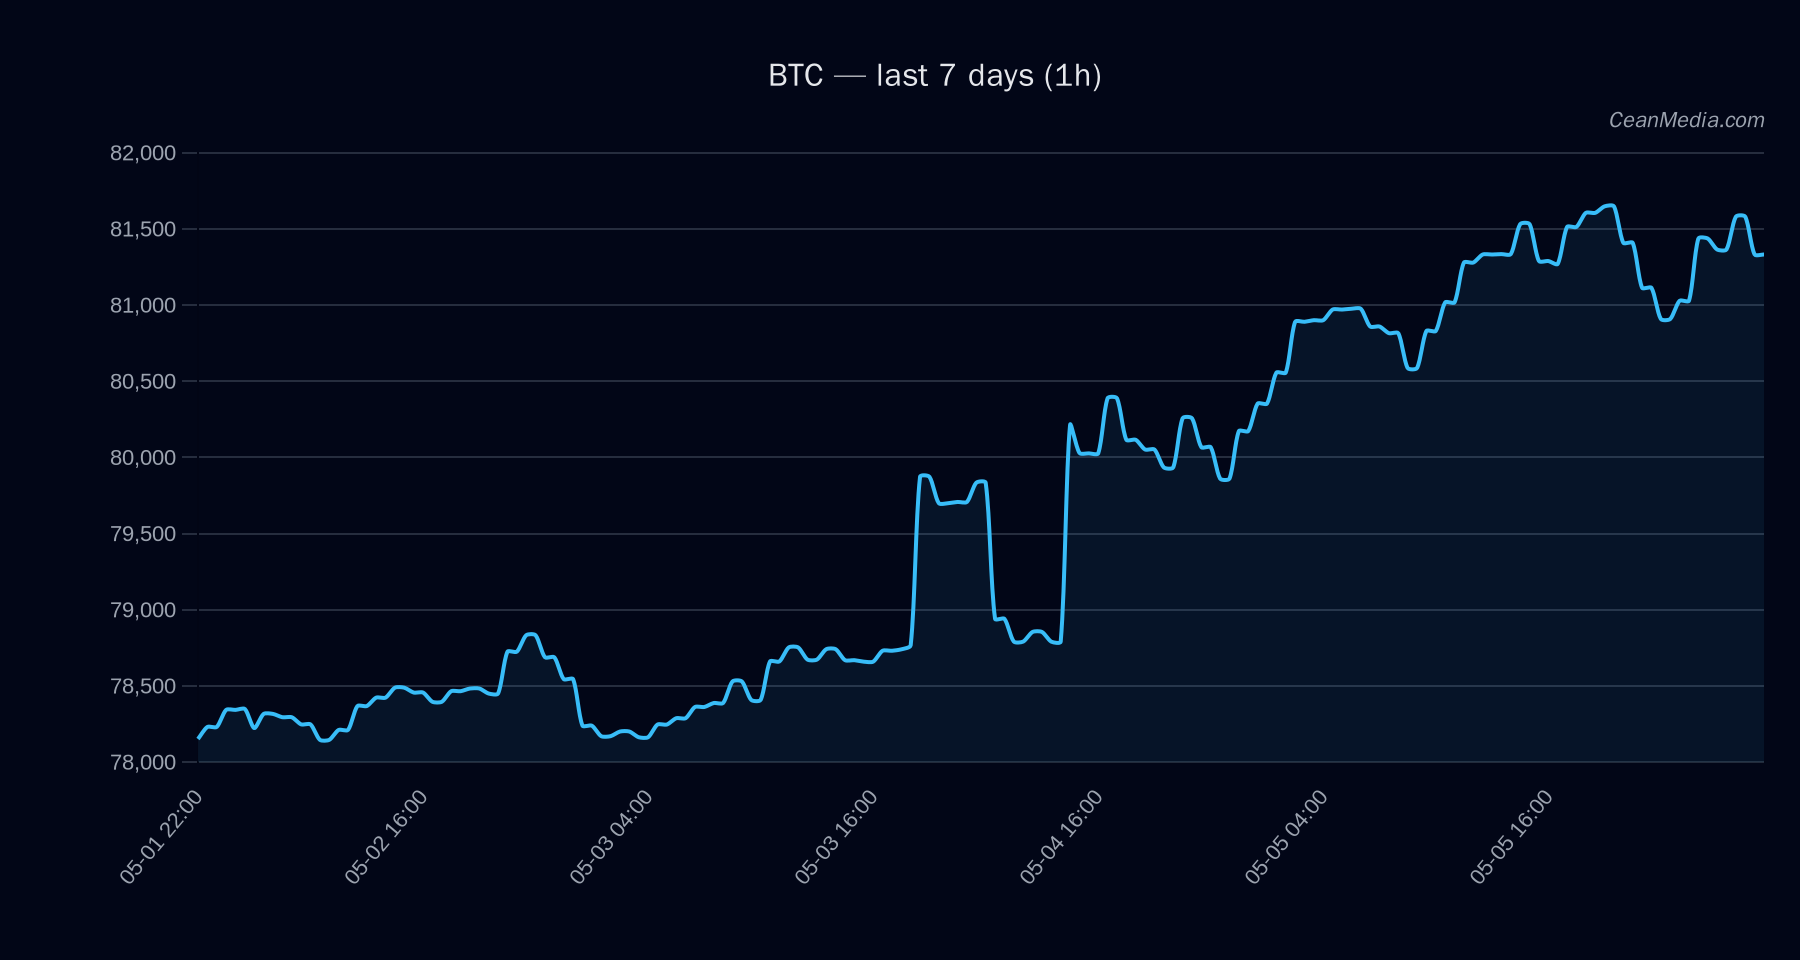
Bitcoin (BTC) remains bid within a defined range, with price near the center of the established support (~79,600) and resistance (~82,850). Market breadth is healthy, and overall risk appetite has supported BTC in the near term. ETF flow data are positive for BTC and ETH, but should be interpreted as context rather than a primary signal for BTC price action.
Technical Analysis: BTC
EMA12 > EMA26; SMA50 > SMA200; RSI 54; volatility regime: very low; 24h σ = 0.24%. Up (50%); P50 range 81,832.84; P20-P80: 79,774.92 – 86,901.63. - Up trigger: 1h close > 82,850 → target 84,507.03 to 86,164.03.
- Down/invalidation: 1h close < 79,600 → target 78,008.99 to 76,416.97.
Drivers
FNG VALUE (+), LS GLOBAL Z-SCORE (negative), SPREAD Z-SCORE (positive), LS TOP Z-SCORE (positive), SPREAD BP (negative), BTC DOMINANCE (negative contribution but higher BTC price). Breadth indicates solid participation (>50%), volatility regime is very low, suggesting a consolidative phase rather than breakout pressure. EMA slope and trend strength are positive; distance from MA indicates modest upside potential with defined risk around the current range.
ETF Flows (BTC/ETH)
ETF flow data provided cover BTC and ETH only. Flows are broadly supportive for BTC and ETH in the immediate term, signaling renewed demand via listed vehicles. It is important to note that ETF data should be interpreted as context and not the primary signal for BTC price direction.
+$629.8M (1D); +$198.4M (5D); +$585.2M (10D). +$101.2M (1D); -$20.8M (5D); +$81.6M (10D).
Contextual takeaway: positive ETF flows suggest ongoing demand in the regulated vehicle space, aligning with a constructive environment for risk assets. However, BTC price action will still be governed by spot market dynamics, macro factors, and on-chain signals. The ETF data should not be treated as a primary driver for BTC on a standalone basis.
What to Watch Next
- Watch for a daily close above 82,850 to validate the near-term up-side trajectory toward 84,507 – 86,164.
- A close below 79,600 would invalidate the immediate bullish bias and target a pullback toward 78,009 – 76,417.
- Monitor ETF flow momentum alongside BTC price action for signs of sustained buying pressure or distribution.
- Keep an eye on volatility regime and breadth as these can shift the probability of a breakout from the current range.
Hashtags: #Bitcoin #BTCAnalysis #CryptoMarkets #ETFFlows #MarketSnapshot #TechnicalAnalysis #TradingStrategy #CryptoNews #BTCUSD #MarketMomentum #RiskAssets #Blockchain