Market Snapshot
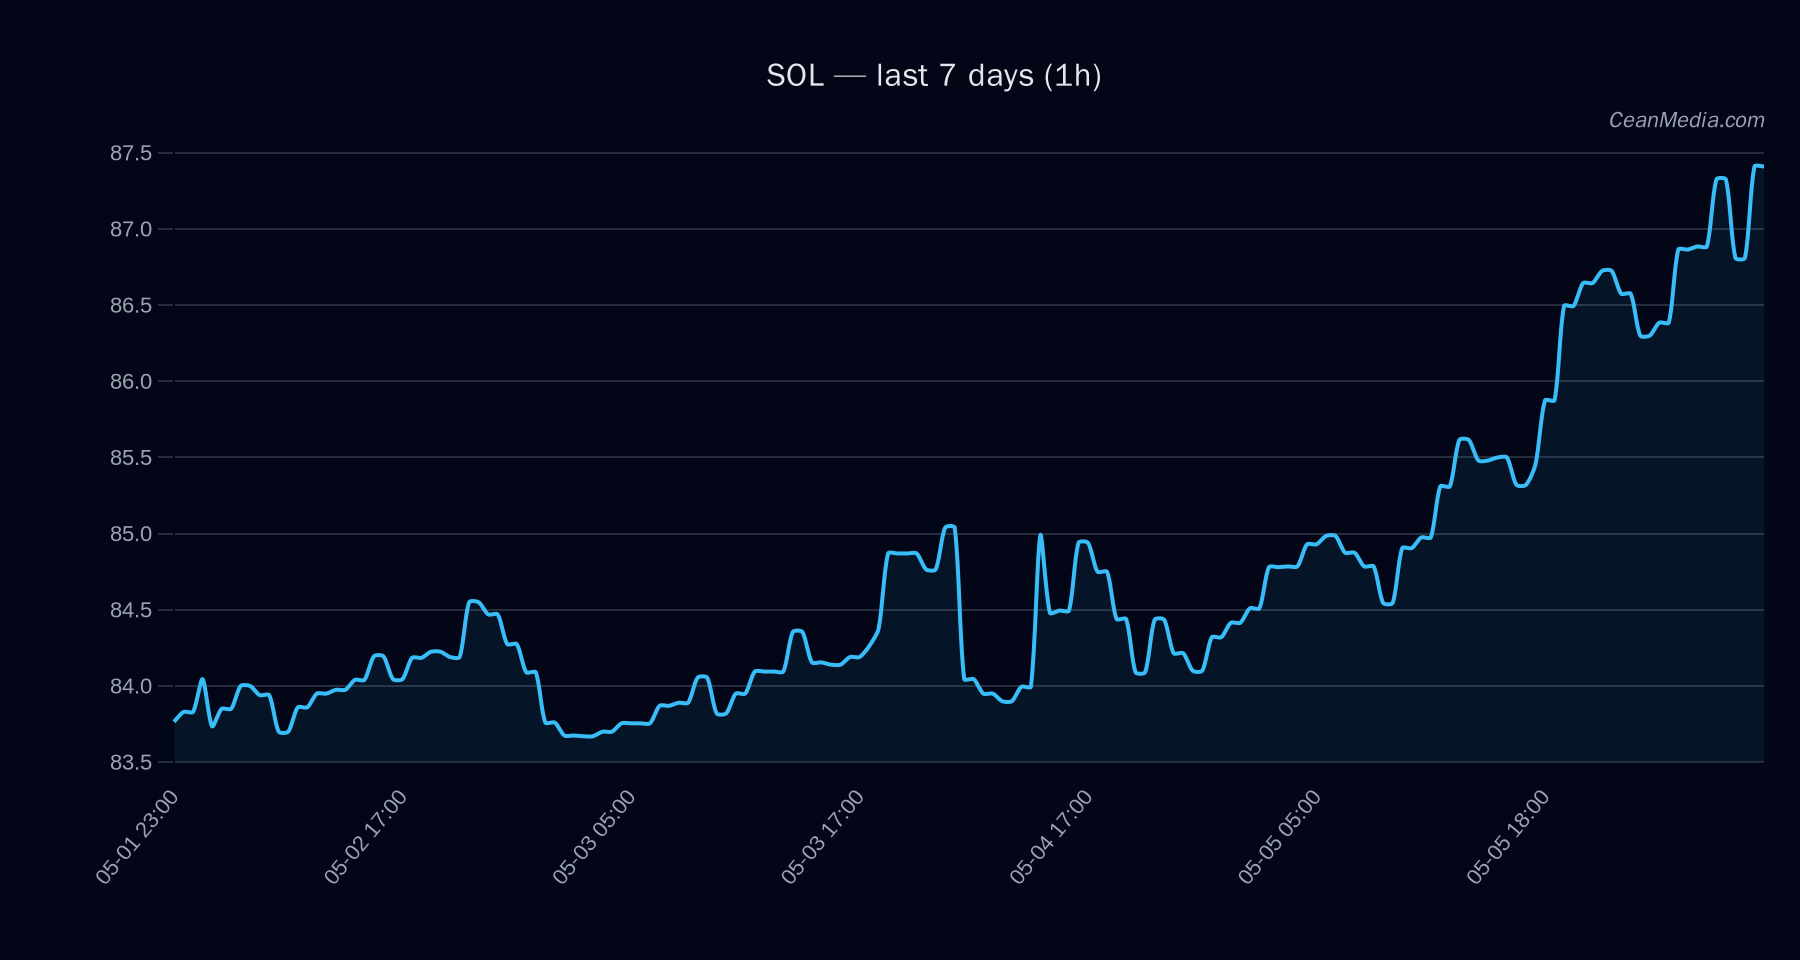
Solana (SOL) trades near the 87 handle with a bullish tilt in the near term. Market breadth remains positive, BTC dominance is modestly higher over 7 days, and overall macro conditions show risk assets supported with very low realized volatility. The immediate price range sits between support around 85.7 and resistance near 89.2, with an intra-range bias leaning bullish given the model forecast and technical confirmations.
Technical Analysis: SOL
: +7.9 : bullish — EMA12 > EMA26, SMA50 > SMA200, RSI 70; σ24h = 0.34%; vol regime: very low : - Support: near 85.7 (major 83.6)
- Resistance: near 89.2 (major 86.7)
- Up trigger: 1h close > 89.2 → target 90.99–92.78
- Down trigger: 1h close < 85.7 → target 83.99–82.28
Drivers
- Top model drivers indicate a positive tilt from price momentum (EMA slope, trend strength) and favorable cross-market signals.
- Key factors include EMA slope, BASIS/Z-Scores, and order-book dynamics showing ongoing buy pressure.
- Vol regime is very low, indicating range-bound activity with compressed volatility unless a breakout occurs.
- BTC dominance near 58.7% with a modest 0.6% weekly increase supports risk assets broadly, contributing to a constructive backdrop for SOL.
- Fear index (F&G) at 46 suggests neutral risk sentiment, not extreme contrarian pressure.
ETF Flows (BTC/ETH)
ETF flow data provided here pertains to BTC and ETH only and is presented for contextual market sentiment. It should not be treated as a primary signal for SOL trading decisions. BTC ETF flows show positive net inflows across 1D, 5D, and 10D intervals, with ETH also showing inflows on 1D but weaker longer-dated momentum. This pattern suggests a risk-on backdrop and liquidity expansion in BTC/ETH markets, which can influence correlated alt assets including SOL in the short term.
- BTC ETF: +$629.8M (1D), +$198.4M (5D), +$585.2M (10D)
- ETH ETF: +$101.2M (1D), -$20.8M (5D), +$81.6M (10D)
What to Watch Next
- Monitor 1h closes around 89.2 to validate upward breakout potential toward 90.99–92.78.
- Watch for a sustained close below 85.7, which could shift momentum toward 83.99–82.28.
- Keep an eye on BTC dominance and broader risk sentiment, as BTC/ETH flows can influence SOL’s short-term moves.
- Observe realized volatility and volume regime shifts, which may precede a breakout from the current narrow range.
Hashtags: #Solana #SOL #CryptoTrading #TechnicalAnalysis #ETFFlows #BTC #ETH #MarketOutlook #Altcoins #RiskOn #Liquidity #PriceAction