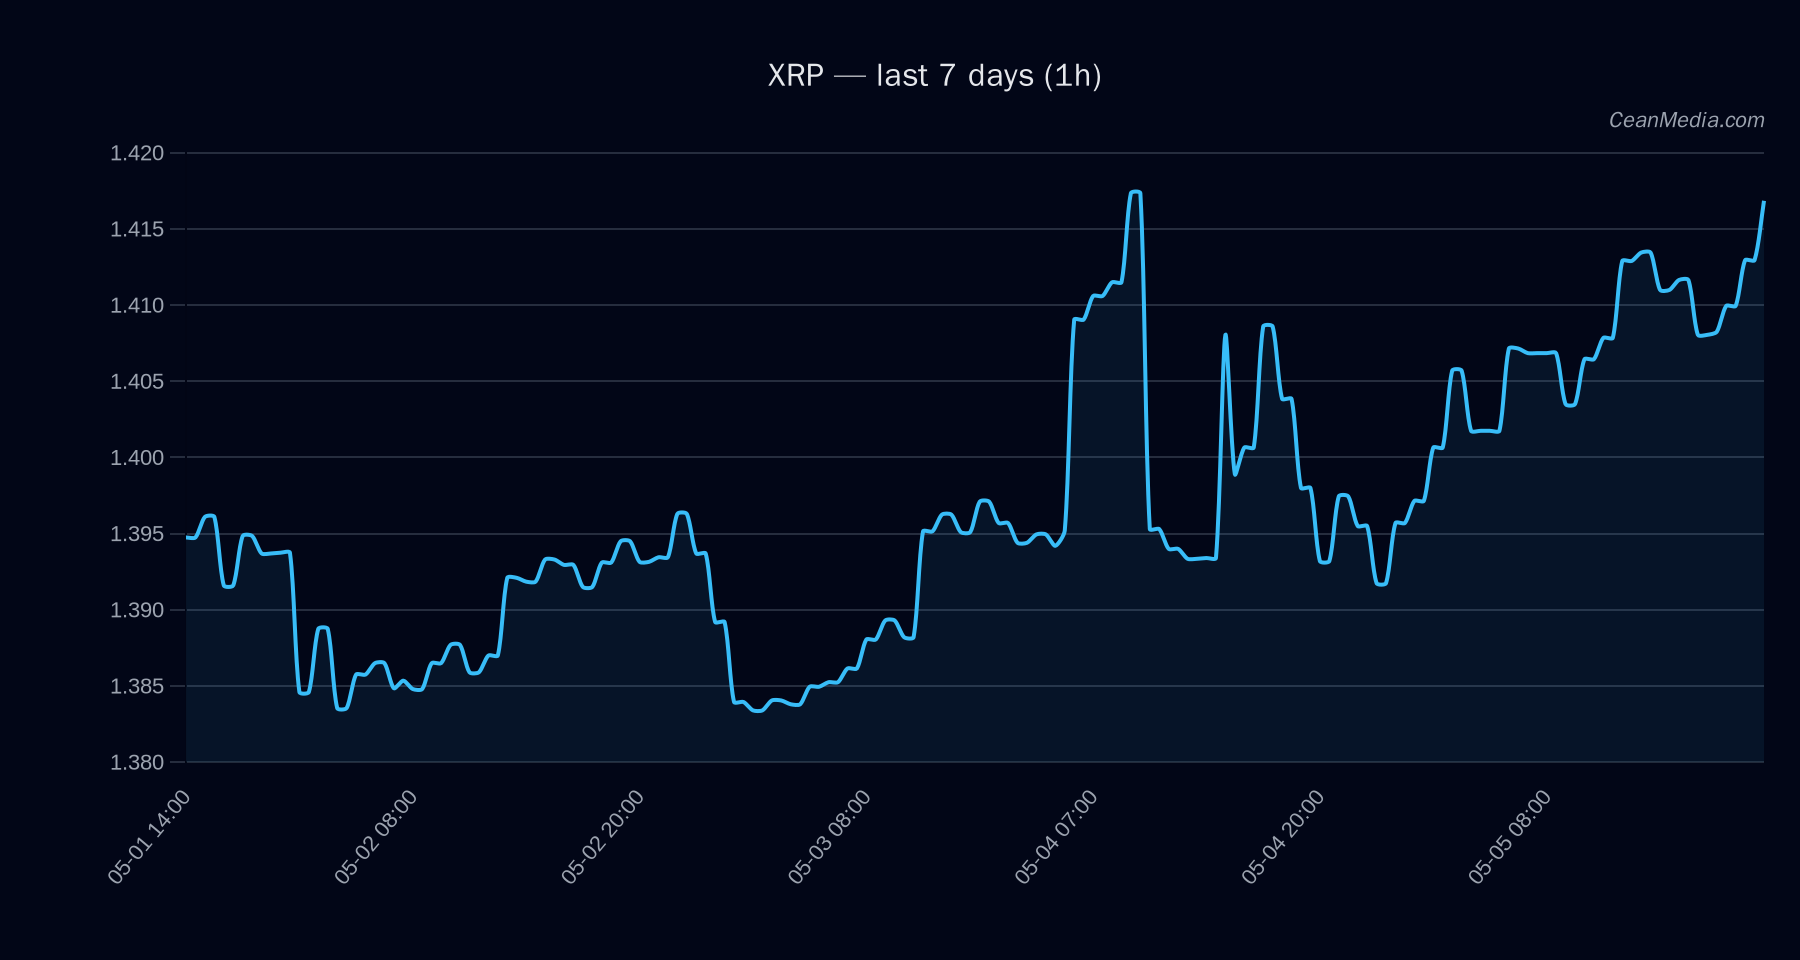
Market Snapshot
As of 2026-05-05, XRP is trading around the 1.41 area with a bullish bias and a high confidence level. The model suggests a sideways range in the near term, with a forecast band spanning roughly 1.39 to 1.57 and a near-term trigger for upside continuation above 1.44.
Technical Analysis: XRP
: +5.0 | conflicts 0 : sideways (19%); Up 38%; Sideways 19%; Down 42% : bullish | RSI 64 : EMA12>EMA26, SMA50>SMA200, RSI 64, low volatility (σ24h 0.21%), very low vol regime : - Support near 1.38 (major 1.38)
- Resistance near 1.44 (major 1.44)
: P50 1.4228; P20-P80 1.3877 – 1.5702 - Up: 1h close > 1.44 ⇒ 1.4735 – 1.5024
- Down: 1h close < 1.38 ⇒ 1.3602 – 1.3325
: No breakout beyond defined triggers; market context shows 100% breadth above SMA50 and BTC dominance around 58.8% with positive short-term momentum.
Context: XRP sits between 1.38 support and 1.44 resistance. The forecast indicates sideways movement with a bullish tilt from TA factors (EMA/RSI/SMA alignment). RSI remains neutral near mid-range.
Drivers
: - FNG VALUE: +3.22 (value 40)
- RV 7D: -1.12 (value -1.54)
- STABLE MCAP LOG1P: -1.09 (value 1.51)
- DRAWDOWN 30D: +0.78 (value 1.37)
- VOL OF VOL: +0.72 (value -1.3)
- SPREAD BP: +0.71 (value -4.43)
: Model indicates sideways trajectory with modest upside potential; vol regime described as very low, implying limited intraday swings but potential for breakouts on trigger events. : Cross-market risk assets supportive; BTC dominance trend higher over 7 days (+0.97), suggesting some volatility-led correlation with broader crypto market moves.
ETF Flows (BTC/ETH)
Context note: ETF flow data provided here is for BTC and ETH only and should be treated as contextual background rather than a primary signal for XRP. ETF flows can influence overall crypto market sentiment, but XRP-specific movements are driven by idiosyncratic factors and XRP-specific technicals.
: 1D +$629.8M; 5D +$198.4M; 10D +$585.2M : 1D +$101.2M; 5D -$20.8M; 10D +$81.6M
Interpretation: The BTC/ETH ETF flows indicate a risk-on backdrop with continued inflows into leading crypto equities, which can support broader market appetite. However, XRP-specific performance may diverge based on its own catalysts and liquidity conditions. Readers should not rely on ETF data as a primary XRP signal, but rather as a supportive macro context.
What to Watch Next
- Monitor for a close above 1.44 to validate the upside trigger toward 1.4735–1.5024.
- Watch for a break below 1.38 to trigger a potential move toward 1.3602–1.3325.
- Observe changes in BTC dominance and overall cross-market risk sentiment, as these can affect XRP’s correlation with the broader market.
- Keep an eye on volatility regime; very low vol may precede abrupt moves if triggers are hit.
Hashtags: #XRP #CryptoAnalysis #MarketUpdate #TechnicalAnalysis #ETFFlows #BTC #ETH #CryptoMarkets #PriceAction #Liquidity #Momentum