Market Snapshot
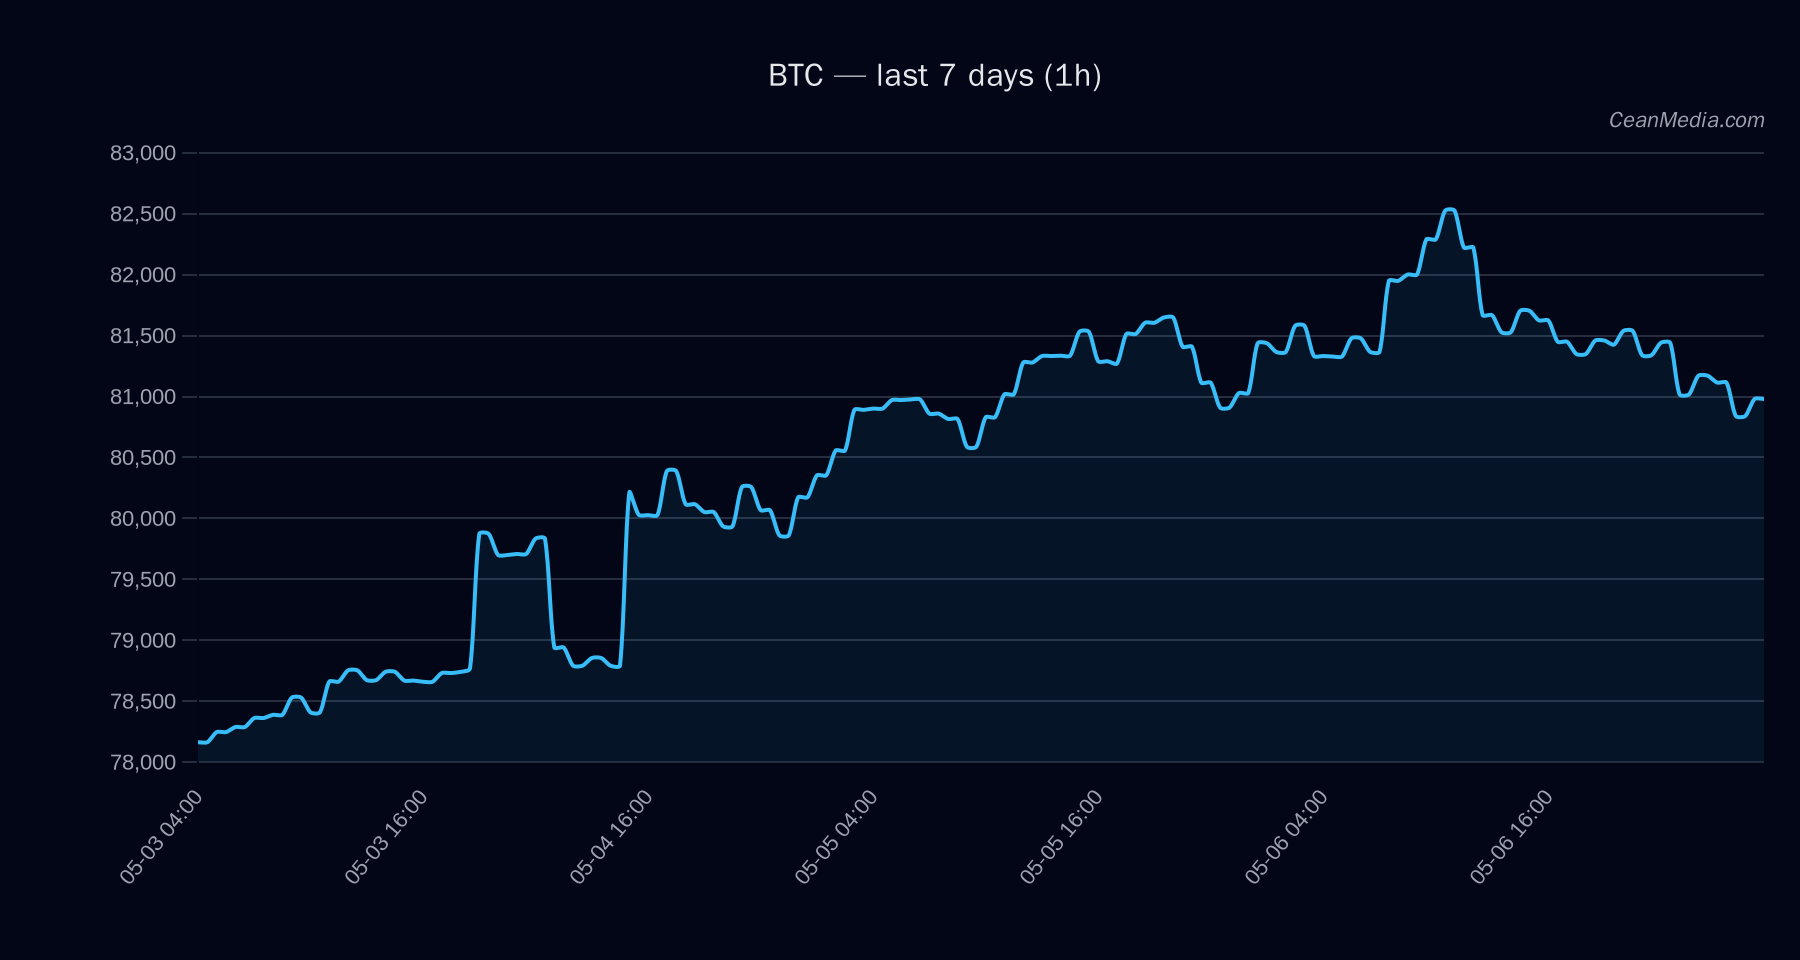
Bitcoin (BTC) closes near 81,072 with a mixed/neutral bias and low certainty (5/100). The composite score sits at -0.3 with zero conflicts. Market breadth is about 50% above the 50-day moving average, and BTC remains highly correlated with risk assets (ρ(BTC,72h) ≈ 1.00). Volatility is very low, and the current ATR and vol unit reflect subdued price action.
Technical Analysis: BTC
-0.3 (Conflicts: 0) EMA12 < EMA26, SMA50 > SMA200, σ24h 0.30%, Vol regime: Very low 82,944.56
- Up: 1h close > 82,700 → target 84,347.44 to 86,001.32
- Down: 1h close < 79,450 → target 77,861.67 to 76,272.66
Forecast probability by direction (24h): Up 47%, Sideways 16.8%, Down 36.0%. The model suggests an upside skew but remains cautious given the sideways price action and low volatility.
Drivers
FNG VALUE, FNG DELTA 7D, SPREAD BP, NASDAQ100 RET 1D, LS TOP DELTA 24H, BTC DOMINANCE Very low vol regime, volatility of volatility (vol of vol) near minimal levels; RSI around neutral Cross-market risk assets supportive; stablecoin liquidity expanding; market sentiment leaning toward fear (~38)
Key internal readings indicate modest negative drift in 24h return signals and a slight negative EMA slope, with a positive basis z-score contributing to a cautious tilt toward upside unless resistance at 82,700 holds.
ETF Flows (BTC/ETH)
Contextual data shows BTC and ETH ETFs with notable intra-day and multi-day inflows. BTC ETF flows are positive across 1D (+629.8M), 5D (+198.4M), and 10D (+585.2M). ETH ETF flows are also positive on 1D (+101.2M) but show mixed signals over longer horizons. It is important to note that ETF data here is BTC/ETH specific and should be treated as contextual information rather than a primary signal for BTC movements.
Interpretation: The ongoing ETF inflows support a risk-on backdrop and may contribute to incremental demand, particularly in a period of low volatility. However, ETF data should be weighed alongside macro signals and underlying price action, given BTC’s current sideways TA tone and the absence of a decisive breakout.
What to Watch Next
- Watch for a 1h close above 82,700 to validate a potential move toward 84,347–86,001.
- Monitor for a breakdown below 79,450 which could open downside targets around 77,862–76,273.
- Keep an eye on ETF flow momentum and cross-market risk signals as volatility remains very low.
- RSI remains neutral; observe any divergence if price tests resistance near 82,700.
Hashtags: #BTC #Bitcoin #MarketAnalysis #ETFFlows #CryptoMarkets #TechnicalAnalysis #CryptoTrading #Volatility #Liquidity #MarketSentiment #PriceAction