
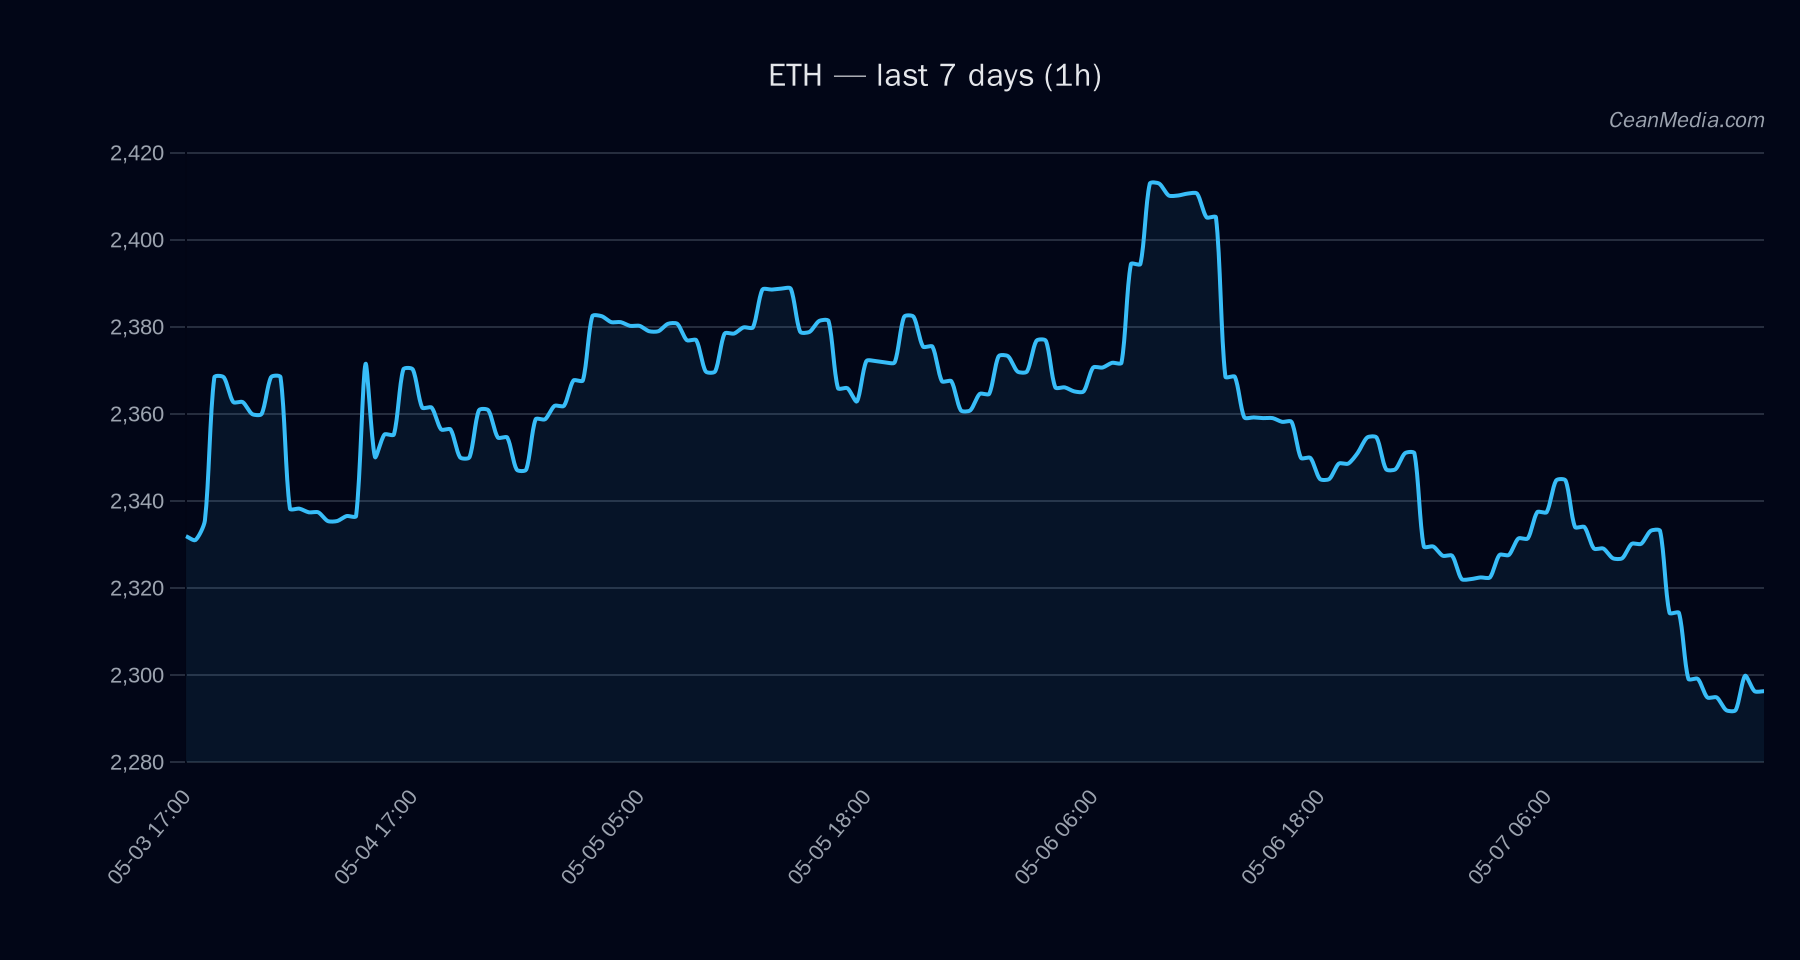
Market Snapshot
ETH traded near the 2,293.12 close with a technical setup described as mixed bias and low conviction. The composite score stands at +3.0 with a single conflicting signal. Market context shows very low volatility and subdued breadth, with BTC-ETH 72-hour correlation high at 0.84, suggesting ETH is moving with broader risk-on/risk-off dynamics but without a clear directional breakout.
Technical Analysis: ETH
EMA12 < EMA26, SMA50 > SMA200, σ24h 0.34%, vol regime: very low. - Current close: 2,293.12
- Support near 2,248; major support at 2,278
- Resistance near 2,338; major resistance at 2,378
P50 to 2,347.86; P20-P80 band 2,299.99 – 2,411.41. - Up trigger: 1h close above 2,338 targets 2,385.76 – 2,432.54.
- Down trigger: 1h close below 2,248 targets 2,202.31 – 2,157.37.
Evidence is not fully aligned; confidence remains moderate and requires trigger confirmation for high-conviction directional calls.
Drivers
FNG Value, FNG Delta (24h), BTC Dominance, NASDAQ 1D return, LS Global Delta. Very low vol regime; ATR 6.94, vol unit 9.17, breadth 33% above SMA50. BTC correlation remains high, suggesting co-movement with risk assets. Sentiment skew shows fear (38) while macro signals indicate risk assets have some supportive cross-market backdrop. BTC dominance sits around 58.3%, with recent delta modestly positive.
ETF Flows (BTC/ETH)
ETF flow data provided here covers BTC and ETH only and should be interpreted as contextual rather than a primary signal for ETH moves. BTC ETFs show notable inflows across 1D, 5D, and 10D horizons, while ETH ETF data indicates a smaller 1D inflow with modest 5D outflows and 10D inflows.
1D +$629.8M | 5D +$198.4M | 10D +$585.2M - ETH ETF: 1D +$101.2M | 5D -$20.8M | 10D +$81.6M
Interpretation: The BTC ETF inflows suggest a risk-on environment accepting higher exposure to major assets, which can support broader crypto risk appetite. ETH ETF data indicates a modest positive tone on shorter horizons but is not a stand-alone signal for ETH direction. Investors should weigh these flows alongside price structure and on-chain signals.
What to Watch Next
- Monitor 1h close relative to 2,338 for a potential upside acceleration toward 2,385–2,432.
- Watch for a break below 2,248, which could expose 2,202–2,157 in the near term.
- Confirm alignment of the EMA/SMA crossovers and RSI movement away from oversold territory to validate a clearer directional bias.
- Stay attentive to BTC price action and BTC dominance changes, as they remain influential given the high 72h correlation.
Hashtags: #ETH #Ethereum #CryptoAnalysis #TechnicalAnalysis #ETFflows #BTC #MarketSnapshot #TradingStrategy #RiskOn #PriceAction #Volatility #MarketContext