Market Snapshot
As of 2026-05-08, Cardano (ADA) displays a mixed to bullish bias with low conviction. The composite score stands at +3.9 with one conflicting signal. Price sits near key support and resistance levels with a narrow forecast range and very low volatility. Global market context shows broad risk sentiment softening, while BTC/ETH ETF flows indicate modest risk-on appetite within the broader crypto complex.
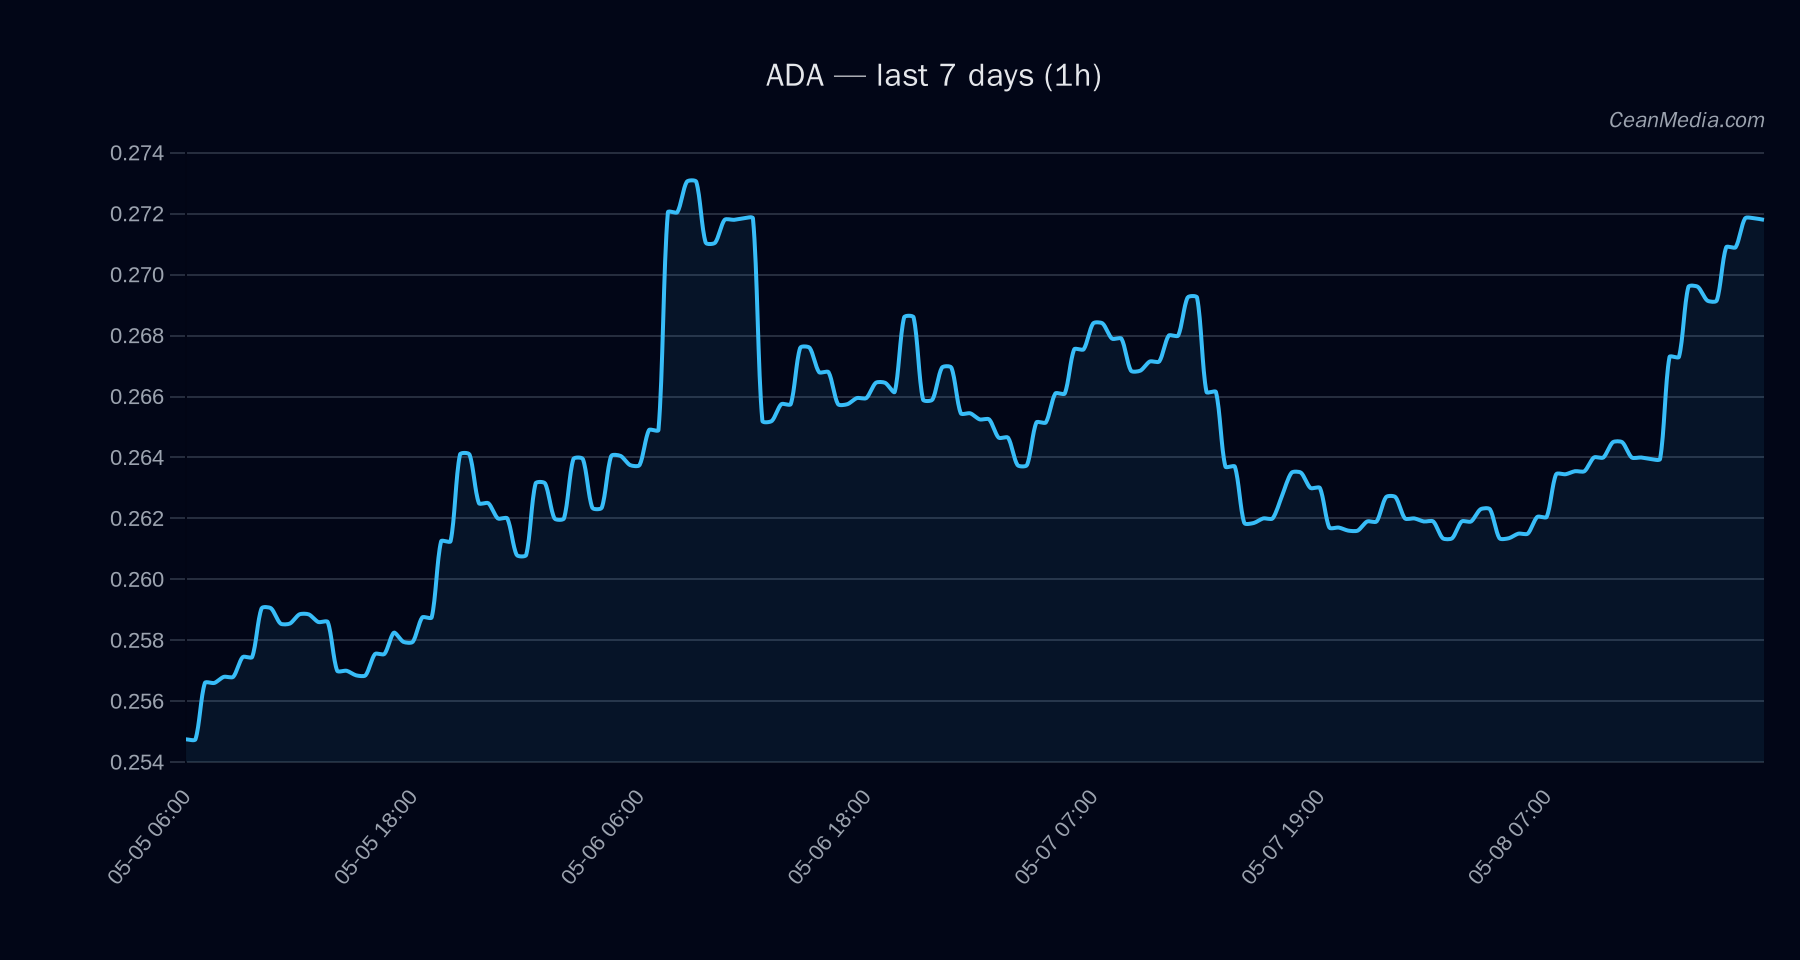
Technical Analysis: ADA
- Price (spot): 0.2719
- Bias and confidence: mixed/bullish pressure; certainty low (44/100)
- Composite score: +3.9
- Trend indicators: TA trend bullish; RSI 75
- Key technical signals: EMA12 > EMA26; SMA50 > SMA200; RSI 75; 24h sigma 0.39%; Volatility regime: Very low
- Forecast range (P50/P20-P80): 0.2745 / 0.258 – 0.2929
- Support / Resistance: Support near 0.265 (major near 0.245); Resistance near 0.275 (major near 0.265)
- Triggers: Up: 1h close > 0.275 targets 0.2829–0.2884; Down: 1h close < 0.265 targets 0.2611–0.2558
- Invalidation/Context: Inside-range condition with no breakout confirmation; RSI indicates overbought nuance
The forecast probability favors an upside move (~57% for the immediate horizon) with sideways and downside probabilities significantly lower or similar. Market breadth is favorable (83% above 50-day SMA), but overall data shows some misalignment among indicators and warrants trigger confirmation before high-conviction positioning.
Drivers
Return 24h, EMA slope, Funding Z-score, Basis Z-score, Order-book imbalance (EMA5), BTC return 24h Very low vol regime; RSIs in overbought territory; crowded long positioning noted Cross-market risk assets softer; stablecoin liquidity expanding; Fear index at 38
Net momentum signals align with a cautious upside bias, but with caution due to conflicting indicators and low volatility that can precede sharp moves.
ETF Flows (BTC/ETH)
Contextual note: ETF flow data shown here covers BTC and ETH only and is not a primary signal for ADA. The figures provide macro-market risk sentiment context that can influence L1/altcoin liquidity and risk appetite.
+$629.8M (1D), +$198.4M (5D), +$585.2M (10D) +$101.2M (1D), -$20.8M (5D), +$81.6M (10D)
The BTC and ETH ETF flows indicate ongoing positive risk-on activity within the blue-chip crypto space. While not a direct driver for ADA, the flows reflect broader market participation and liquidity conditions that can influence altcoins through correlated dynamics or risk-off/risk-on shifts.
What to Watch Next
- Watch for a 1h close above 0.275 to confirm the upside extension toward 0.2829–0.2884.
- Monitor for a break below 0.265 that would open the path toward 0.2611–0.2558.
- Observe changes in ETF flows for BTC/ETH as a qualitative risk indicator, while keeping ADA-specific signals primary.
- Keep an eye on volatility regime shifts, as Very Low volatility can precede sudden moves with amplified breakouts.
Hashtags: #ADA #CryptoAnalysis #MarketSnapshot #TechnicalAnalysis #ETFFlows #BTC #ETH #Altcoins #DeFi #MarketBias #RiskOn #Liquidity