Market Snapshot
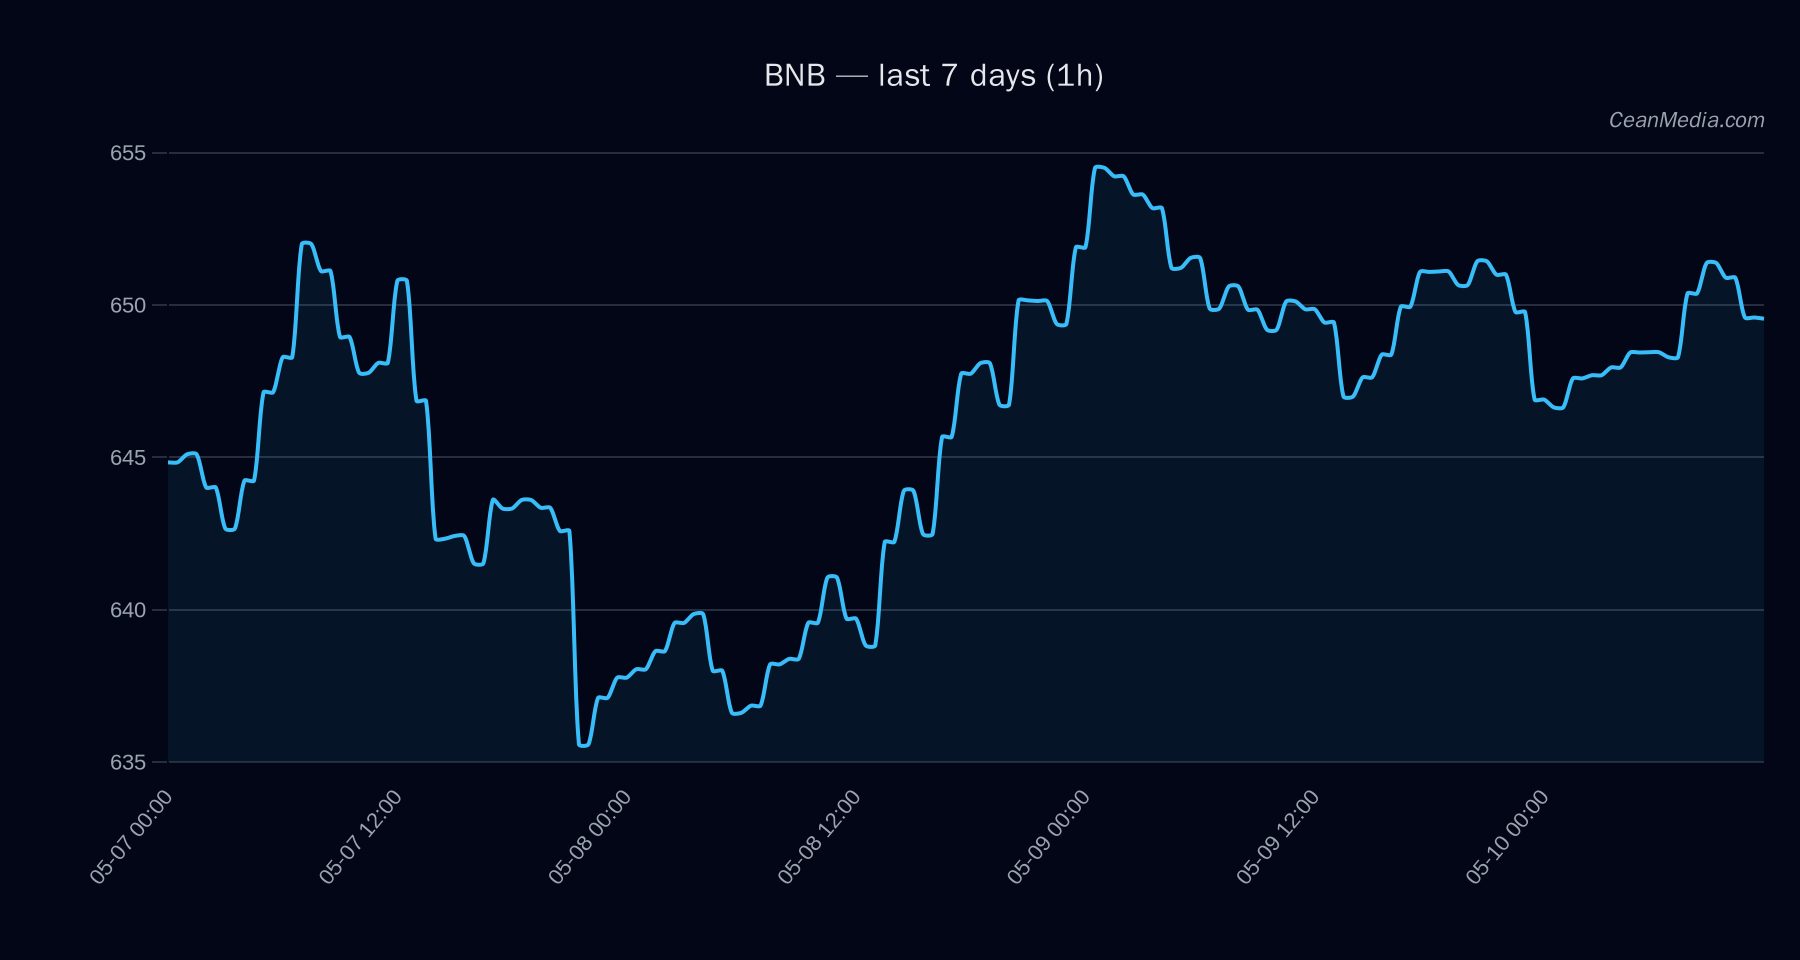
Date: 2026-05-10 | Primary Asset: BNB
Current price: 649.68. Market context shows very low volatility with breadth at 100% above SMA50 and a BTC correlation of 0.51 over 72 hours. ETF flows are positive for BTC and ETH, offering supportive capital inflows to risk assets, though ETF data should be treated as context rather than a primary signal for BNB trading decisions.
Technical Analysis: BNB
- bullish | certainty 53/100
- +3.7 | conflicts 0
- 649.68
- EMA12 > EMA26, SMA50 > SMA200, RSI 52, σ24h 0.17%, Vol regime: Very low
- Down (46%), with Up 34%, Side 21%
Key levels:
- Support: near 637; Major: 618
- Resistance: near 663; Major: 649
Triggers:
- Up: 1h close > 663 → target ~675.93 to ~689.18
- Down: 1h close < 637 → target ~623.95 to ~611.22
Interpretation: The price is positioned between defined support and resistance. While the TA trend remains bullish, the forecast suggests a higher probability of a near-term down move within the context of a tight trading range. RSI is neutral, not indicating overbought conditions at present.
Drivers
- SPREAD BP, NASDAQ100 5D, LS TOP Z-SCORE, BTC RV 24H, SP500 5D, FNG VALUE
- Very low volatility regime with 100% breadth above SMA50, BTC/Dominance around 58.3%
- Taker buy pressure and long positioning (1.47x) suggest support for a cautious buildup in long exposure
Overall, the composite signal points to a modest bullish bias with a notable risk of near-term downside if price breaks below 637, given the trigger downside levels.
ETF Flows (BTC/ETH)
Contextual note: ETF flow data provided here relates to BTC and ETH only and should not be interpreted as a primary signal for BNB trading decisions. Positive ETF inflows into BTC and ETH indicate risk-on sentiment and broader liquidity support for crypto assets, which can indirectly influence altcoins, including BNB.
- 1D +$629.8M | 5D +$198.4M | 10D +$585.2M
- 1D +$101.2M | 5D -$20.8M | 10D +$81.6M
Interpretation: Net positive ETF flows in BTC and ETH over daily and multi-day horizons suggest risk appetite remains supportive. This context can bolster risk assets broadly, but does not constitute a direct signal for BNB price action.
What to Watch Next
- Monitor 1h close relative to 663 resistance for potential breakout or rejection.
- Watch 637 support breach for downside validation toward 623 and 611 levels.
- Observe changes in volatility regime; a shift from Very Low could alter risk sentiment and trigger levels.
- Track BTC ETF flows as corroborative context for broader market risk appetite.
Hashtags: #BNB #CryptoMarkets #TechnicalAnalysis #ETFFlows #MarketSnapshot #CryptoNews