Market Snapshot
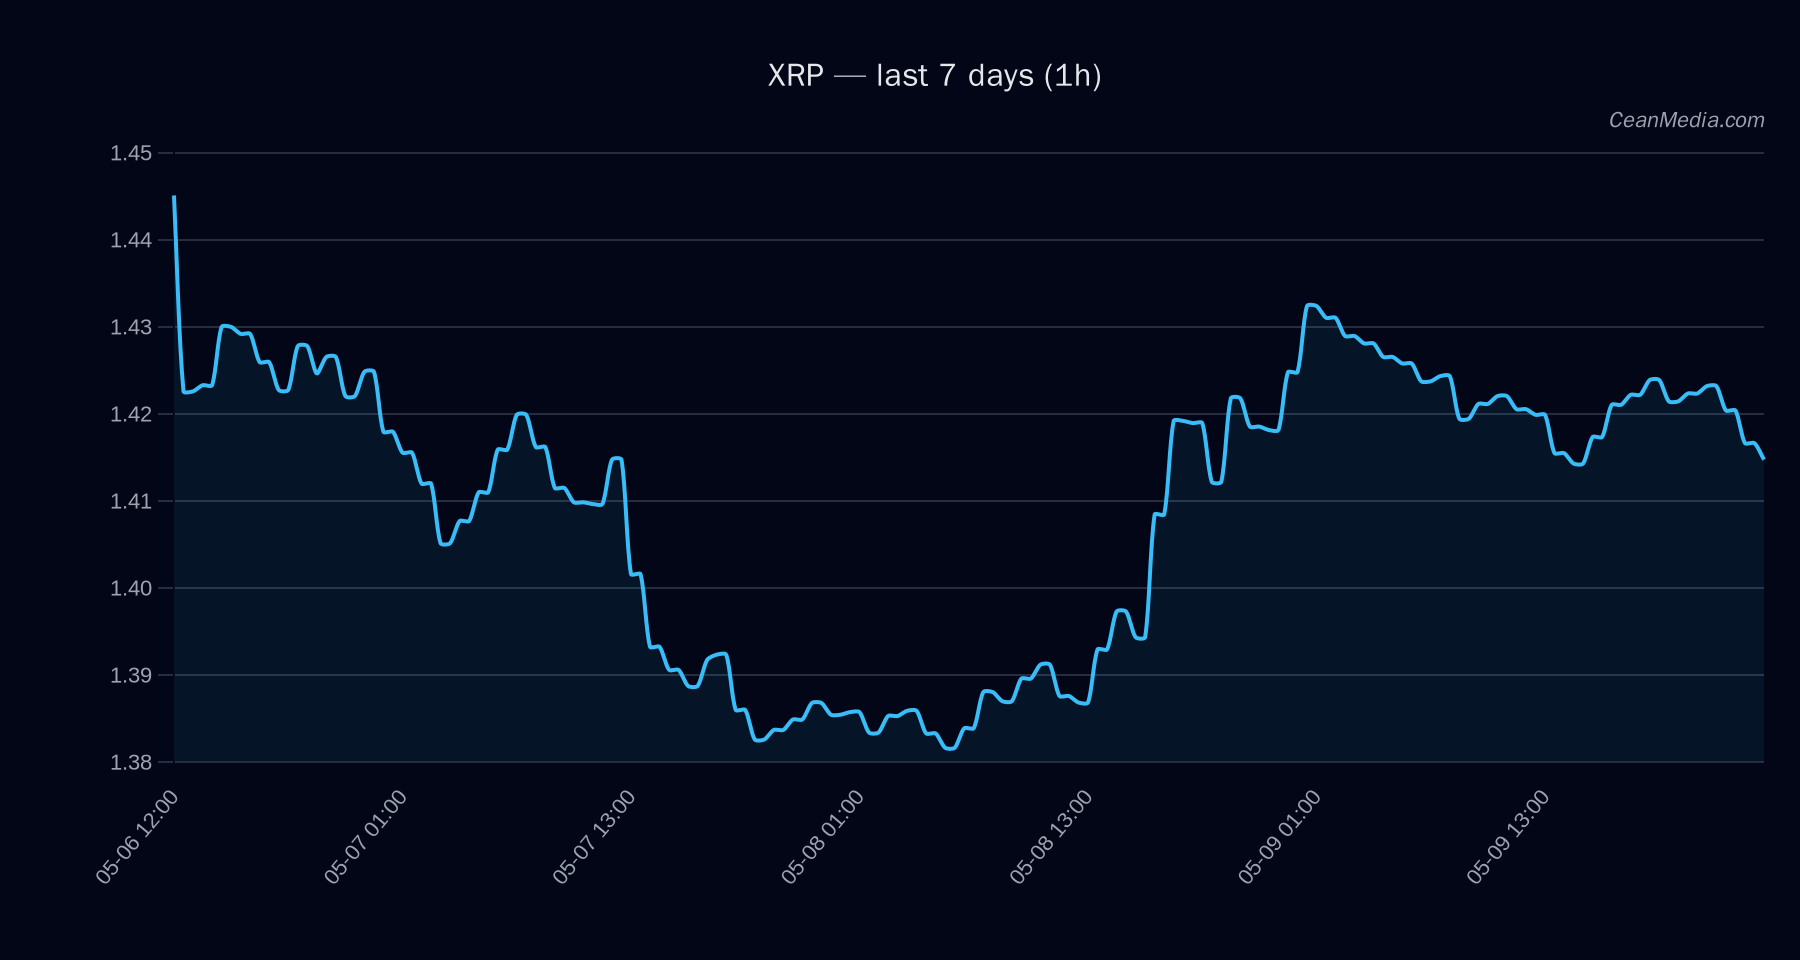
On 2026-05-10, XRP sits in a narrow range with near-term support at 1.38 and resistance at 1.44. The composite view is bullish with a low certainty (39/100). Price is trading at 1.4152, and the forecast suggests a sideways bias with a 12% probability in that direction, while upside and downside probabilities are 43% and 45% respectively according to the model breakdown.
Technical Analysis: XRP
EMA12 > EMA26, SMA50 > SMA200, RSI 45, volatility regime: very low 1.4152 1.4265 - Support near 1.38 (major 1.38)
- Resistance near 1.44 (major 1.44)
- Up: 1h close above 1.44 → 1.4724 / 1.5012
- Down: 1h close below 1.38 → 1.3592 / 1.3314
Technical Trend: bullish; RSI neutral at 45. The volatility measure (σ24h) is 0.15%, with a very low volatility regime, supporting a range-bound dynamic in the near term.
Drivers
FNG VALUE, NASDAQ100 5D return, RV 7D, STABLE MCAP LOG1P, DRAWDOWN 30D, SP500 5D return breadth at 67% above SMA50, BTC correlation 0.71 over 72h, alt breadth ex-mega at 50% fear index around mid‑40s (38), with stablecoin liquidity showing moderate expansion (0.32% over 7D) model assigns a net sideways forecast (12%), indicating limited directional conviction in XRP near term.
ETF Flows (BTC/ETH)
The ETF flows data provided cover BTC and ETH rather than XRP. Reported figures show:
- BTC ETF: 1D +$629.8M; 5D +$198.4M; 10D +$585.2M
- ETH ETF: 1D +$101.2M; 5D -$20.8M; 10D +$81.6M
Interpretation: ETF flow activity is a context signal for risk appetite and liquidity in the broader crypto and macro markets. It should be noted that ETF data is BTC/ETH-specific and is not a primary signal for XRP. The presence of positive BTC/ETH flows can reflect a risk-on environment, which may indirectly influence XRP through correlated demand or liquidity flows.
What to Watch Next
- Monitor for a close above 1.44 on any 1-hour candle to confirm a potential upside or a move toward 1.4724–1.5012.
- Watch for a break below 1.38 on a 1-hour close, which would open downside targets around 1.3592–1.3314.
- Keep an eye on BTC/ETH ETF flow momentum as a contextual risk-on/off signal for broader market liquidity and potential XRP correlations.
- Observe changes in volatility regime and breadth readings, which could precede a shift in XRP’s directional bias.
Hashtags: #XRP #CryptoAnalysis #MarketSnapshot #TechnicalAnalysis #ETFFlows #Bitcoin #Ethereum #RiskOn #Liquidity #AltMarkets #TradingStrategy #CryptoNews