Market Snapshot
On 2026-05-14, XRP traded around 1.42 with a mixed/neutral bias and low confidence (5/100). The composite score is -0.3 with 3% data gaps. Market breadth is weak, with BTC dominance around 58.15%. Overall volatility remains very low.
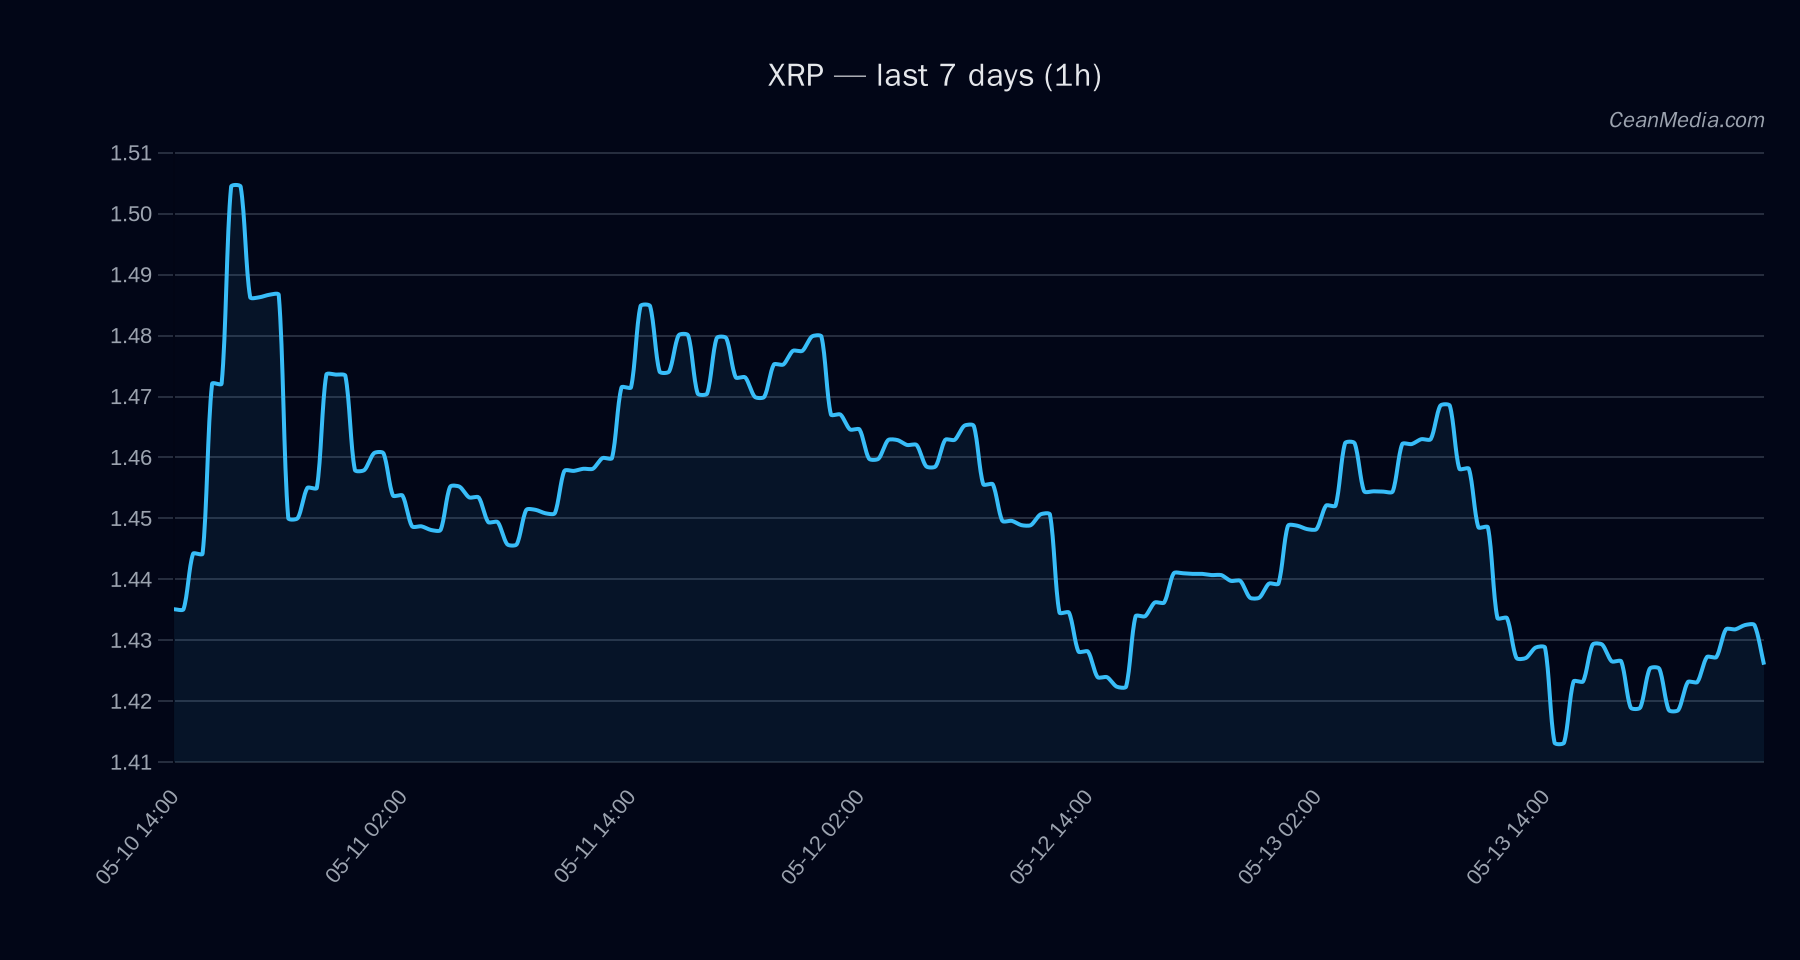
Technical Analysis: XRP
Current price: 1.4236
Bias: mixed / neutral; certainty low
Trend: sideways
Key indicators: RSI 43; EMA12 < EMA26; SMA50 > SMA200; σ24h 0.53%; Volatility regime: Very low
- Forecast (Model): Up 47% / Sideways 11% / Down 42% (probabilistic)
- Forecast Range: P50 1.4019; P20-P80 1.3665 – 1.4589
Levels
- Support near 1.40; Major support at 1.38
- Resistance near 1.46; Major resistance at 1.46
Triggers
- Up trigger: 1h close > 1.46 → 1.4811 / 1.5102
- Down trigger: 1h close < 1.40 → 1.3672 / 1.3393
Invalidation: Breakouts/validations within the stated range; no breakout confirmation beyond current inside-range dynamics
Drivers
- Top drivers indicate a mixed momentum: price-levels (EMA slopes) negative on a short horizon; liquidity metrics reveal a negative funding Z-score but positive basis Z-score; order-book imbalance shows modest buy pressure (EMA5)
- Macro context shows risk assets broadly supportive with BTC returns negative over 24h but BTC dominance placing risk-on context in focus
- Volatility regime remains very low, with low breadth signals and fear index around 34
ETF Flows (BTC/ETH)
Contextual note: ETF flow data shown here pertains to BTC and ETH only. This is not a primary signal for XRP and should be interpreted as macro-risk sentiment context that may influence correlated markets. BTC ETFs show +$629.8M 1D, +$198.4M 5D, +$585.2M 10D; ETH ETFs show +$101.2M 1D, -$20.8M 5D, +$81.6M 10D. Overall, the BTC/ETH ETF flows indicate a risk-on backdrop over shorter horizons but should not be taken as XRP-specific catalysts.
What to Watch Next
- Monitor 1.46 resistance for potential upside break and validation of the 1.4811–1.5102 target band
- Watch for a break below 1.40 to assess downside continuation toward 1.3672–1.3393
- Assess changes in risk sentiment as BTC/ETH ETF flows evolve over 1–2 days
- Keep an eye on volatility regime shifts which could alter RSI and momentum signals
Hashtags: #XRP #CryptoAnalysis #TechnicalAnalysis #ETFFlows #MarketSnapshot #CryptoMarkets #PriceLevels #RiskOn #BTC #ETH #Liquidity #Momentum